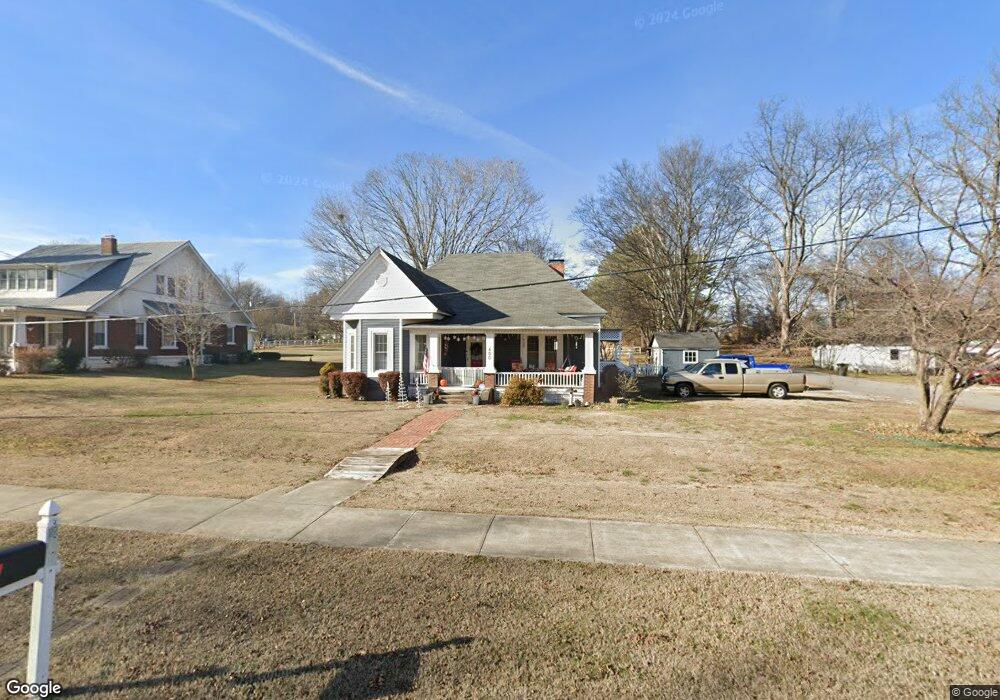
400 W Broad St Decherd, TN 37324
Estimated Value: $162,151 - $218,000
--
Bed
2
Baths
1,574
Sq Ft
$125/Sq Ft
Est. Value
About This Home
This home is located at 400 W Broad St, Decherd, TN 37324 and is currently estimated at $196,788, approximately $125 per square foot. 400 W Broad St is a home located in Franklin County with nearby schools including North Middle School, Franklin County High School, and School of the Good Shepherd.
Ownership History
Date
Name
Owned For
Owner Type
Purchase Details
Closed on
Aug 10, 2012
Sold by
Moore Susan K
Bought by
Moore Ronald L
Current Estimated Value
Purchase Details
Closed on
Dec 6, 2007
Sold by
Clark N D
Bought by
Moore Ronald L
Home Financials for this Owner
Home Financials are based on the most recent Mortgage that was taken out on this home.
Original Mortgage
$84,600
Interest Rate
6.22%
Purchase Details
Closed on
Mar 18, 1986
Purchase Details
Closed on
Jul 19, 1985
Purchase Details
Closed on
Aug 6, 1957
Create a Home Valuation Report for This Property
The Home Valuation Report is an in-depth analysis detailing your home's value as well as a comparison with similar homes in the area
Home Values in the Area
Average Home Value in this Area
Purchase History
| Date | Buyer | Sale Price | Title Company |
|---|---|---|---|
| Moore Ronald L | -- | -- | |
| Moore Ronald L | $87,450 | -- | |
| -- | $25,000 | -- | |
| -- | -- | -- | |
| -- | -- | -- |
Source: Public Records
Mortgage History
| Date | Status | Borrower | Loan Amount |
|---|---|---|---|
| Previous Owner | Not Available | $84,600 |
Source: Public Records
Tax History Compared to Growth
Tax History
| Year | Tax Paid | Tax Assessment Tax Assessment Total Assessment is a certain percentage of the fair market value that is determined by local assessors to be the total taxable value of land and additions on the property. | Land | Improvement |
|---|---|---|---|---|
| 2024 | $676 | $24,175 | $3,400 | $20,775 |
| 2023 | $676 | $24,550 | $3,400 | $21,150 |
| 2022 | $639 | $24,550 | $3,400 | $21,150 |
| 2021 | $490 | $24,550 | $3,400 | $21,150 |
| 2020 | $701 | $17,475 | $2,525 | $14,950 |
| 2019 | $701 | $17,475 | $2,525 | $14,950 |
| 2018 | $799 | $21,000 | $2,525 | $18,475 |
| 2017 | $799 | $21,000 | $2,525 | $18,475 |
| 2016 | $732 | $19,250 | $2,525 | $16,725 |
| 2015 | $733 | $19,250 | $2,525 | $16,725 |
| 2014 | $732 | $19,234 | $0 | $0 |
Source: Public Records
Map
Nearby Homes
- 104 3rd Ave N
- 501 W Broad St
- 102 2nd Ave N
- 106 5th Ave N
- 202 W Main St
- 203 5th Ave N
- 101 Iris St
- 206 Hotel St
- 904 W Market St
- 502 E Market St
- 107 N West St
- 35 Sunshine Cir Unit 37
- 909 Cumberland St Unit 911
- 207 Powell St
- 107 10th Ave N
- 406 Horton St
- 1003 Cumberland St Unit 1005
- 408 Horton St
- 1011 Cumberland St Unit 1013
- 1101 Cumberland St Unit 1103