400 W Perkins Ave Unit B Mc Farland, CA 93250
--
Bed
--
Bath
35,519
Sq Ft
3.25
Acres
About This Home
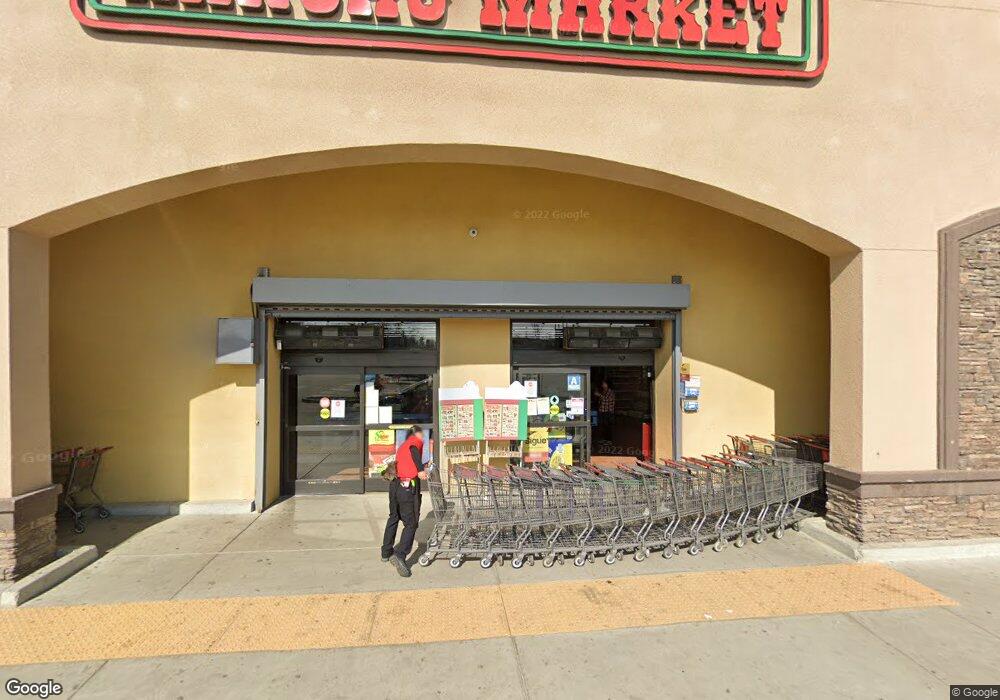
This home is located at 400 W Perkins Ave Unit B, Mc Farland, CA 93250. 400 W Perkins Ave Unit B is a home located in Kern County with nearby schools including McFarland High School.
Ownership History
Date
Name
Owned For
Owner Type
Purchase Details
Closed on
Nov 28, 2017
Sold by
Shick Clinton C
Bought by
Kwock Jerrey and Leung Ming C
Purchase Details
Closed on
Oct 10, 2017
Sold by
K & L Stores
Bought by
Kwock & Leung Partnership
Create a Home Valuation Report for This Property
The Home Valuation Report is an in-depth analysis detailing your home's value as well as a comparison with similar homes in the area
Home Values in the Area
Average Home Value in this Area
Purchase History
| Date | Buyer | Sale Price | Title Company |
|---|---|---|---|
| Kwock Jerrey | -- | None Available | |
| Kwock & Leung Partnership | -- | None Available |
Source: Public Records
Tax History Compared to Growth
Tax History
| Year | Tax Paid | Tax Assessment Tax Assessment Total Assessment is a certain percentage of the fair market value that is determined by local assessors to be the total taxable value of land and additions on the property. | Land | Improvement |
|---|---|---|---|---|
| 2025 | $23,151 | $2,003,012 | $80,831 | $1,922,181 |
| 2024 | $22,886 | $1,963,995 | $79,247 | $1,884,748 |
| 2023 | $22,886 | $1,927,052 | $77,694 | $1,849,358 |
| 2022 | $22,485 | $1,893,549 | $76,171 | $1,817,378 |
| 2021 | $22,237 | $1,856,782 | $74,678 | $1,782,104 |
| 2020 | $21,803 | $1,837,933 | $73,913 | $1,764,020 |
| 2019 | $20,513 | $1,837,933 | $73,913 | $1,764,020 |
| 2018 | $20,368 | $1,777,888 | $71,044 | $1,706,844 |
| 2017 | $19,832 | $1,743,597 | $69,651 | $1,673,946 |
| 2016 | $19,557 | $1,709,979 | $68,286 | $1,641,693 |
| 2015 | $19,184 | $1,684,730 | $67,261 | $1,617,469 |
| 2014 | $18,432 | $1,672,555 | $65,944 | $1,606,611 |
Source: Public Records
Map
Nearby Homes
- 830 Davis Ave
- 249 Robertson Ave
- 0 W Sherwood Ave Unit 202506495
- 0 W Sherwood Ave Unit 21453658
- 733 Ensenata Dr
- 450 8th St
- 539 11th St
- 124 4th Place
- 276 San Juan St
- 389 Mount Arbor St
- 254 E Sherwood Ave
- 148 San Lucas St
- 0 E Sherwood Ave
- 737 Misty Ave
- 13271 Garzoli Ave
- 583 Taylor Ave
- 805 Price St
- 852 Butte St
- 836 Fletcher St
- Floorplan 2000 AP at Tierra Del Sol