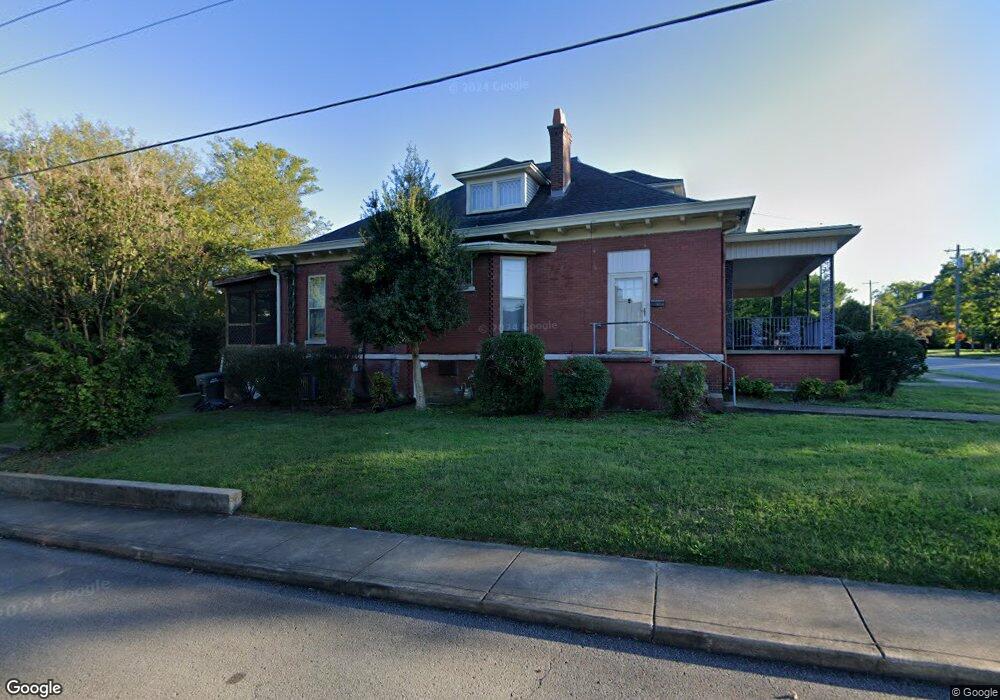
400 Walnut St Unit B Springfield, TN 37172
Estimated Value: $415,000 - $473,000
4
Beds
3
Baths
2,400
Sq Ft
$186/Sq Ft
Est. Value
About This Home
This home is located at 400 Walnut St Unit B, Springfield, TN 37172 and is currently estimated at $445,896, approximately $185 per square foot. 400 Walnut St Unit B is a home located in Robertson County with nearby schools including Cheatham Park Elementary School, Westside Elementary School, and Innovation Academy.
Ownership History
Date
Name
Owned For
Owner Type
Purchase Details
Closed on
May 9, 2022
Sold by
Justice Steven R
Bought by
Asare Kwame and Asare Serwaa
Current Estimated Value
Home Financials for this Owner
Home Financials are based on the most recent Mortgage that was taken out on this home.
Original Mortgage
$340,000
Outstanding Balance
$322,122
Interest Rate
5.27%
Mortgage Type
New Conventional
Estimated Equity
$123,774
Purchase Details
Closed on
Dec 28, 2021
Sold by
Fletcher Denise D
Bought by
Justice Steven R
Home Financials for this Owner
Home Financials are based on the most recent Mortgage that was taken out on this home.
Original Mortgage
$375,000
Interest Rate
3.11%
Mortgage Type
Purchase Money Mortgage
Purchase Details
Closed on
Aug 30, 1995
Sold by
Dodd Mary Sue
Bought by
Dodd Robert E
Purchase Details
Closed on
Mar 29, 1983
Bought by
Dodd Mary Sue
Create a Home Valuation Report for This Property
The Home Valuation Report is an in-depth analysis detailing your home's value as well as a comparison with similar homes in the area
Home Values in the Area
Average Home Value in this Area
Purchase History
| Date | Buyer | Sale Price | Title Company |
|---|---|---|---|
| Asare Kwame | $425,000 | New Title Company Name | |
| Justice Steven R | $375,000 | None Listed On Document | |
| Dodd Robert E | -- | -- | |
| Dodd Robert E | -- | -- | |
| Dodd Mary Sue | -- | -- |
Source: Public Records
Mortgage History
| Date | Status | Borrower | Loan Amount |
|---|---|---|---|
| Open | Asare Kwame | $340,000 | |
| Previous Owner | Justice Steven R | $375,000 |
Source: Public Records
Tax History
| Year | Tax Paid | Tax Assessment Tax Assessment Total Assessment is a certain percentage of the fair market value that is determined by local assessors to be the total taxable value of land and additions on the property. | Land | Improvement |
|---|---|---|---|---|
| 2025 | -- | $175,280 | $22,000 | $153,280 |
| 2024 | -- | $175,280 | $22,000 | $153,280 |
| 2023 | $4,391 | $175,280 | $22,000 | $153,280 |
| 2022 | $1,648 | $45,175 | $3,125 | $42,050 |
| 2021 | $1,648 | $45,175 | $3,125 | $42,050 |
| 2020 | $1,648 | $45,175 | $3,125 | $42,050 |
| 2019 | $49,564 | $45,175 | $3,125 | $42,050 |
| 2018 | $1,648 | $45,175 | $3,125 | $42,050 |
| 2017 | $1,915 | $44,700 | $6,150 | $38,550 |
| 2016 | $1,915 | $44,700 | $6,150 | $38,550 |
| 2015 | $1,860 | $44,700 | $6,150 | $38,550 |
| 2014 | $1,860 | $44,700 | $6,150 | $38,550 |
Source: Public Records
Map
Nearby Homes
Your Personal Tour Guide
Ask me questions while you tour the home.