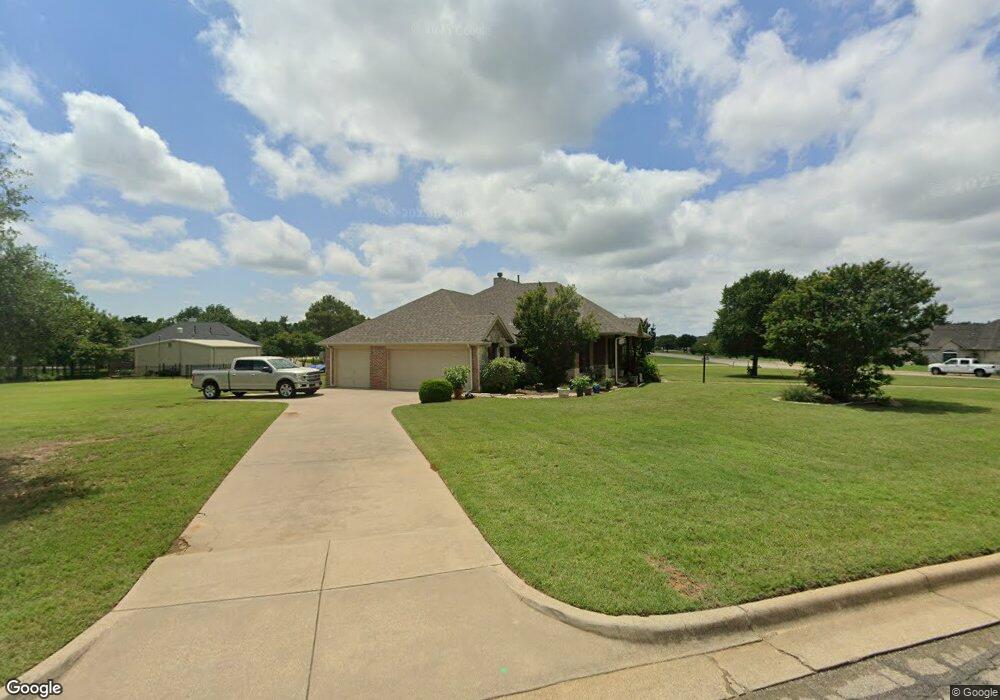
4000 Glenwood Dr Joshua, TX 76058
Estimated Value: $493,168 - $596,000
4
Beds
2
Baths
2,677
Sq Ft
$200/Sq Ft
Est. Value
About This Home
This home is located at 4000 Glenwood Dr, Joshua, TX 76058 and is currently estimated at $535,542, approximately $200 per square foot. 4000 Glenwood Dr is a home located in Johnson County with nearby schools including Plum Creek Elementary School, Joshua High School, and Joshua High School - 9th Grade Campus.
Ownership History
Date
Name
Owned For
Owner Type
Purchase Details
Closed on
Mar 1, 2022
Sold by
Millet Sofia D
Bought by
Millet Sofia D and Chambers Fred B
Current Estimated Value
Purchase Details
Closed on
Feb 25, 2022
Sold by
Millet Sofia D
Bought by
Millet Sofia D and Chambers Fred B
Purchase Details
Closed on
Dec 5, 2019
Sold by
Chambers Fred
Bought by
Millet Sofia D and Chambers Fred
Purchase Details
Closed on
Mar 14, 2017
Sold by
Schmidt Brant Alan
Bought by
Marti George Wesley and Marti George Wesley
Purchase Details
Closed on
Feb 12, 2015
Sold by
Millet Sofia D
Bought by
Millet Sofia D and Chambers Fred
Home Financials for this Owner
Home Financials are based on the most recent Mortgage that was taken out on this home.
Original Mortgage
$408,000
Interest Rate
3.73%
Mortgage Type
FHA
Create a Home Valuation Report for This Property
The Home Valuation Report is an in-depth analysis detailing your home's value as well as a comparison with similar homes in the area
Home Values in the Area
Average Home Value in this Area
Purchase History
| Date | Buyer | Sale Price | Title Company |
|---|---|---|---|
| Millet Sofia D | -- | None Listed On Document | |
| Millet Sofia D | -- | None Listed On Document | |
| Millet Sofia D | -- | None Available | |
| Marti George Wesley | -- | Stewart Title | |
| Millet Sofia D | -- | Timios Title |
Source: Public Records
Mortgage History
| Date | Status | Borrower | Loan Amount |
|---|---|---|---|
| Previous Owner | Millet Sofia D | $408,000 |
Source: Public Records
Tax History Compared to Growth
Tax History
| Year | Tax Paid | Tax Assessment Tax Assessment Total Assessment is a certain percentage of the fair market value that is determined by local assessors to be the total taxable value of land and additions on the property. | Land | Improvement |
|---|---|---|---|---|
| 2025 | $3,478 | $473,358 | $36,000 | $437,358 |
| 2024 | $10,343 | $424,996 | $0 | $0 |
| 2023 | $3,444 | $432,672 | $36,000 | $396,672 |
| 2022 | $8,813 | $391,989 | $36,000 | $355,989 |
| 2021 | $8,083 | $341,135 | $36,000 | $305,135 |
| 2020 | $7,947 | $290,277 | $36,000 | $254,277 |
| 2019 | $7,922 | $290,277 | $36,000 | $254,277 |
| 2018 | $7,402 | $290,277 | $36,000 | $254,277 |
| 2017 | $6,725 | $269,936 | $36,000 | $233,936 |
| 2016 | $6,114 | $206,900 | $36,000 | $170,900 |
| 2015 | $5,345 | $206,900 | $36,000 | $170,900 |
| 2014 | $5,345 | $206,900 | $36,000 | $170,900 |
Source: Public Records
Map
Nearby Homes
- 6013 Valley View Dr
- 2009 Running Brook Dr
- 2021 Running Brook Dr
- 3004 Valley View Dr
- 3012 Valley View Dr
- 4012 Twin Hills Ct
- Scottsdale II Plan at Joshua Meadows
- Lexington SE Plan at Joshua Meadows
- Nottingham I Plan at Joshua Meadows
- Fairview SE Plan at Joshua Meadows
- Wildwood SE Plan at Joshua Meadows
- Henderson Plan at Joshua Meadows
- Kingswood Plan at Joshua Meadows
- Nottingham II Plan at Joshua Meadows
- Scottsdale I Plan at Joshua Meadows
- Bellaire SE Plan at Joshua Meadows
- Westwood SE Plan at Joshua Meadows
- El Dorado Plan at Joshua Meadows
- Ashwood Plan at Joshua Meadows
- 5012 Pheasant Run Dr
- 3000 Big Springs Dr
- 4003 Crestwood Dr
- 4008 Glenwood Dr
- 4005 Glenwood Dr
- 2017 Big Springs Dr
- 4009 Glenwood Dr
- 4001 Crestwood Dr
- 3010 Big Springs Dr
- 3001 Big Springs Dr
- 4009 Crestwood Dr
- 4001 Pheasant Run Dr
- 2012 Big Springs Dr
- 3004 Glenwood Dr
- 4012 Glenwood Dr
- 4001 Valley View Dr
- 6009 Valley View Dr
- 5005 Valley View Dr
- 4004 Crestwood Dr
- 4012 Crestwood Dr
- 3005 Big Springs Dr