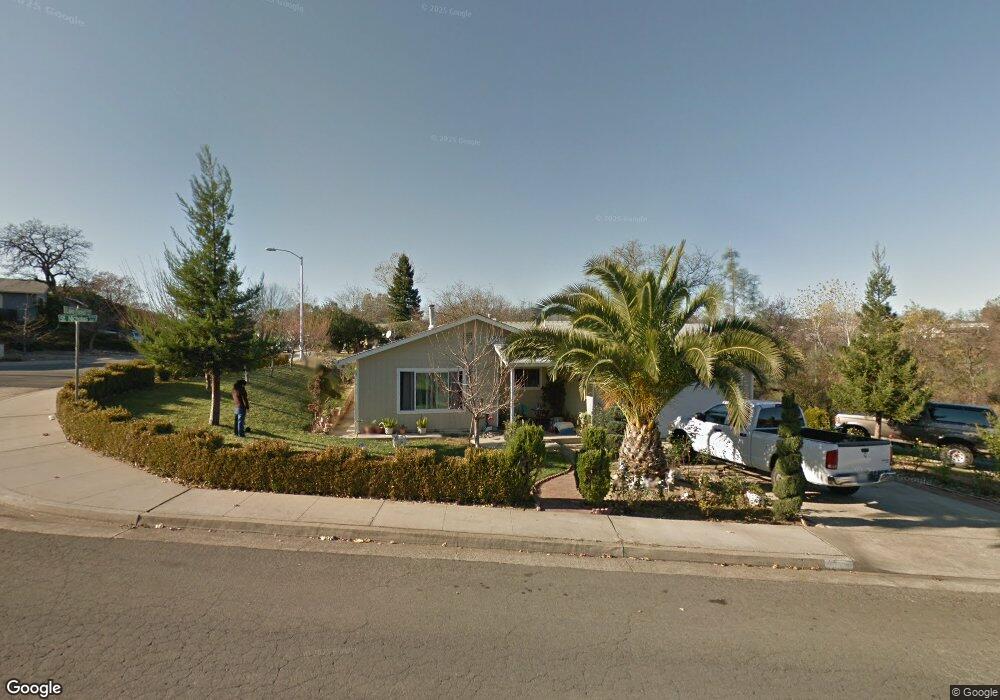
4000 St Nicholas Ave Unit 1 Redding, CA 96003
Buckeye NeighborhoodEstimated Value: $304,000 - $348,739
3
Beds
2
Baths
1,225
Sq Ft
$266/Sq Ft
Est. Value
About This Home
This home is located at 4000 St Nicholas Ave Unit 1, Redding, CA 96003 and is currently estimated at $325,435, approximately $265 per square foot. 4000 St Nicholas Ave Unit 1 is a home located in Shasta County with nearby schools including Rocky Point Charter School.
Ownership History
Date
Name
Owned For
Owner Type
Purchase Details
Closed on
Jul 27, 2023
Sold by
Herrera Moises Valverde
Bought by
Howland Sharon G and Christie John Craig
Current Estimated Value
Home Financials for this Owner
Home Financials are based on the most recent Mortgage that was taken out on this home.
Original Mortgage
$271,600
Outstanding Balance
$265,272
Interest Rate
6.69%
Mortgage Type
New Conventional
Estimated Equity
$60,163
Purchase Details
Closed on
Oct 8, 2004
Sold by
Valverde Guadalupe E
Bought by
Herrera Moises Valverde
Home Financials for this Owner
Home Financials are based on the most recent Mortgage that was taken out on this home.
Original Mortgage
$160,000
Interest Rate
5.82%
Mortgage Type
New Conventional
Purchase Details
Closed on
Dec 17, 2001
Sold by
Sterni John W and Sterni Sharon L
Bought by
Herrera Moises Valverde and Valverde Guadalupe E
Home Financials for this Owner
Home Financials are based on the most recent Mortgage that was taken out on this home.
Original Mortgage
$118,937
Interest Rate
7.17%
Mortgage Type
FHA
Create a Home Valuation Report for This Property
The Home Valuation Report is an in-depth analysis detailing your home's value as well as a comparison with similar homes in the area
Home Values in the Area
Average Home Value in this Area
Purchase History
| Date | Buyer | Sale Price | Title Company |
|---|---|---|---|
| Howland Sharon G | $280,000 | First American Title | |
| Herrera Moises Valverde | -- | Chicago Title Co | |
| Herrera Moises Valverde | $120,000 | Fidelity National Title Co |
Source: Public Records
Mortgage History
| Date | Status | Borrower | Loan Amount |
|---|---|---|---|
| Open | Howland Sharon G | $271,600 | |
| Previous Owner | Herrera Moises Valverde | $160,000 | |
| Previous Owner | Herrera Moises Valverde | $118,937 |
Source: Public Records
Tax History Compared to Growth
Tax History
| Year | Tax Paid | Tax Assessment Tax Assessment Total Assessment is a certain percentage of the fair market value that is determined by local assessors to be the total taxable value of land and additions on the property. | Land | Improvement |
|---|---|---|---|---|
| 2025 | $3,078 | $285,600 | $61,200 | $224,400 |
| 2024 | $1,889 | $280,000 | $60,000 | $220,000 |
| 2023 | $1,889 | $170,368 | $42,586 | $127,782 |
| 2022 | $1,764 | $167,028 | $41,751 | $125,277 |
| 2021 | $1,739 | $163,754 | $40,933 | $122,821 |
| 2020 | $1,730 | $162,076 | $40,514 | $121,562 |
| 2019 | $1,676 | $158,899 | $39,720 | $119,179 |
| 2018 | $1,675 | $155,785 | $38,942 | $116,843 |
| 2017 | $1,645 | $152,731 | $38,179 | $114,552 |
| 2016 | $1,573 | $149,737 | $37,431 | $112,306 |
| 2015 | $1,547 | $147,489 | $36,869 | $110,620 |
| 2014 | $1,557 | $144,601 | $36,147 | $108,454 |
Source: Public Records
Map
Nearby Homes
- 3757 Magnums Way
- 3588 Magnums Way
- 3671 Santa Rosa Way
- 3639 E Keswick Dam Rd
- 729 July Way
- 820 Middle St
- 3505 Tamarack Dr
- 1350 Aztec Path
- 4098 Saint Patricks Ave
- 0 Lake Blvd
- 1120 Shawnee Trail
- 1450 Calexico Dr
- 1070 Dara Ct
- 1450 Greenback Ln
- 940 Golden Heights Ct
- 3291 Keswick Dam Rd
- 3488 Oasis Rd
- 4412 Eagle Nest Rd
- 1187 Mountain Shadows Blvd
- 1220 Mountain Shadows Blvd Unit 263
- 4000 Saint Nicholas Ave
- 3795 Lake Forest Dr
- 4015 St Nicholas Ave
- 4015 Saint Nicholas Ave
- 3770 Lake Forest Dr
- 3777 Lake Forest Dr
- 3955 Saint Nicholas Ave
- 1111 Guinevere $1kbuyer$
- 3787 Magnums Way
- 3765 Lake Forest Dr Unit 1
- 3765 Lake Forest Dr
- 3758 Lake Forest Dr
- 4007 Saint Nicholas Ave
- 3950 Saint Nicholas Ave
- 820 August Way
- 910 August Way
- 3775 Magnums Way
- 3793 Magnums Way
- 920 August Way
- 3743 Lake Forest Dr