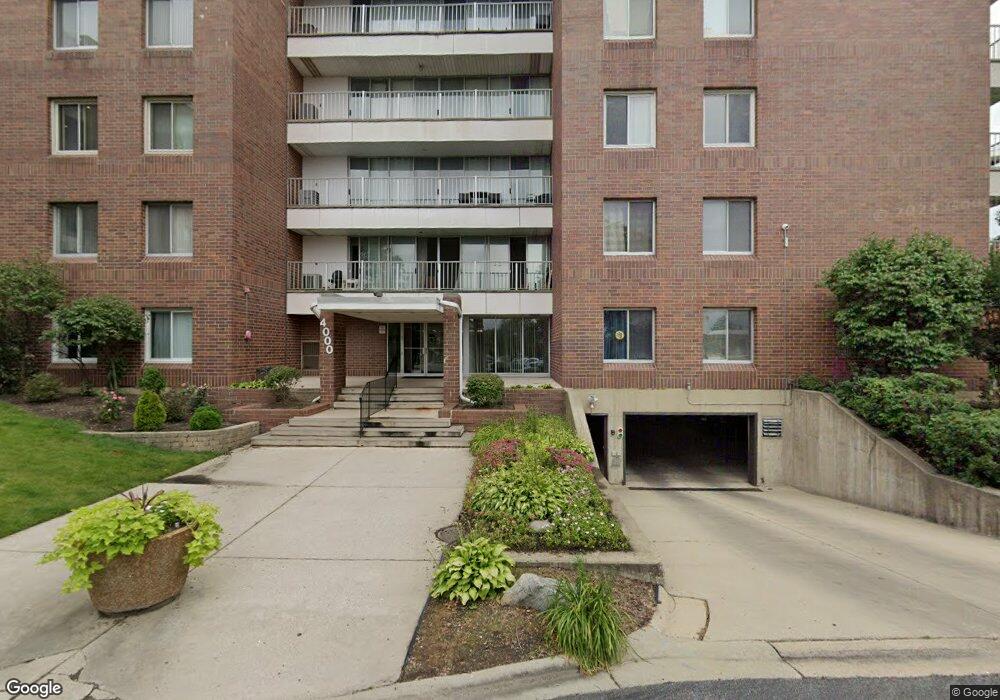
4000 Triumvera Dr Unit A103 Glenview, IL 60025
Estimated Value: $228,963 - $316,000
2
Beds
--
Bath
1,307
Sq Ft
$211/Sq Ft
Est. Value
About This Home
This home is located at 4000 Triumvera Dr Unit A103, Glenview, IL 60025 and is currently estimated at $275,241, approximately $210 per square foot. 4000 Triumvera Dr Unit A103 is a home located in Cook County with nearby schools including Henking Elementary School, Hoffman Elementary School, and Springman Middle School.
Ownership History
Date
Name
Owned For
Owner Type
Purchase Details
Closed on
Sep 9, 1999
Sold by
Alfaro Florante M and Gayo Alfaro Glenny Leigh M
Bought by
Fishman Garry
Current Estimated Value
Home Financials for this Owner
Home Financials are based on the most recent Mortgage that was taken out on this home.
Original Mortgage
$114,000
Outstanding Balance
$34,810
Interest Rate
8.21%
Estimated Equity
$240,431
Purchase Details
Closed on
Mar 30, 1994
Sold by
Kapnick Willard
Bought by
Alfaro Florante M and Gayo Alfaro Glenny Leigh M
Home Financials for this Owner
Home Financials are based on the most recent Mortgage that was taken out on this home.
Original Mortgage
$85,500
Interest Rate
7.51%
Purchase Details
Closed on
Mar 28, 1988
Sold by
Kapnick Hannahruth
Bought by
Kapnick Willard
Purchase Details
Closed on
Jun 8, 1977
Sold by
Kapnick Willard
Bought by
Kapnick Hannahruth
Create a Home Valuation Report for This Property
The Home Valuation Report is an in-depth analysis detailing your home's value as well as a comparison with similar homes in the area
Home Values in the Area
Average Home Value in this Area
Purchase History
| Date | Buyer | Sale Price | Title Company |
|---|---|---|---|
| Fishman Garry | $120,000 | -- | |
| Alfaro Florante M | $60,000 | -- | |
| Kapnick Willard | -- | -- | |
| Kapnick Willard | -- | -- | |
| Kapnick Hannahruth | -- | -- |
Source: Public Records
Mortgage History
| Date | Status | Borrower | Loan Amount |
|---|---|---|---|
| Open | Fishman Garry | $114,000 | |
| Previous Owner | Alfaro Florante M | $85,500 |
Source: Public Records
Tax History Compared to Growth
Tax History
| Year | Tax Paid | Tax Assessment Tax Assessment Total Assessment is a certain percentage of the fair market value that is determined by local assessors to be the total taxable value of land and additions on the property. | Land | Improvement |
|---|---|---|---|---|
| 2024 | $3,113 | $16,545 | $389 | $16,156 |
| 2023 | $2,912 | $16,545 | $389 | $16,156 |
| 2022 | $2,912 | $16,545 | $389 | $16,156 |
| 2021 | $2,662 | $13,619 | $264 | $13,355 |
| 2020 | $2,703 | $13,619 | $264 | $13,355 |
| 2019 | $2,534 | $15,095 | $264 | $14,831 |
| 2018 | $2,144 | $12,273 | $229 | $12,044 |
| 2017 | $2,098 | $12,273 | $229 | $12,044 |
| 2016 | $2,172 | $12,273 | $229 | $12,044 |
| 2015 | $1,828 | $9,974 | $185 | $9,789 |
| 2014 | $1,801 | $9,974 | $185 | $9,789 |
| 2013 | $1,736 | $9,974 | $185 | $9,789 |
Source: Public Records
Map
Nearby Homes
- 3732 Capri Ct Unit T18A
- 10430 Michael Todd Terrace
- 701 Forum Square Unit 609
- 600 Naples Ct Unit 510
- 600 Naples Ct Unit 107
- 600 Naples Ct Unit 608
- 10385 Dearlove Rd Unit 1I
- 4150 Central Rd Unit 3E
- 625 Quincy Bridge Ln Unit 301
- 4170 Cove Ln Unit 2B
- 10347 Dearlove Rd Unit 302
- 4004 Denice Ct Unit 3
- 533 Cherry Ln
- 1018 Castilian Ct Unit A205
- 1026 Castilian Ct Unit D162
- 509 Elder Ln
- 9517 W Central Rd
- 3420 Greenbriar Dr
- 9411 Harrison St Unit 471494
- 342 Cherry Ln
- 4000 Triumvera Dr Unit A208
- 4000 Triumvera Dr Unit A508
- 4000 Triumvera Dr Unit A404
- 4000 Triumvera Dr Unit A101
- 4000 Triumvera Dr Unit A407
- 4000 Triumvera Dr Unit A504
- 4000 Triumvera Dr Unit A502
- 4000 Triumvera Dr Unit A401
- 4000 Triumvera Dr Unit A308
- 4000 Triumvera Dr Unit A202
- 4000 Triumvera Dr Unit A307
- 4000 Triumvera Dr Unit A301
- 4000 Triumvera Dr Unit A205
- 4000 Triumvera Dr Unit A204
- 4000 Triumvera Dr Unit A501
- 4000 Triumvera Dr Unit A206
- 4000 Triumvera Dr Unit A203
- 4000 Triumvera Dr Unit A106
- 4000 Triumvera Dr Unit A403
- 4000 Triumvera Dr Unit A405