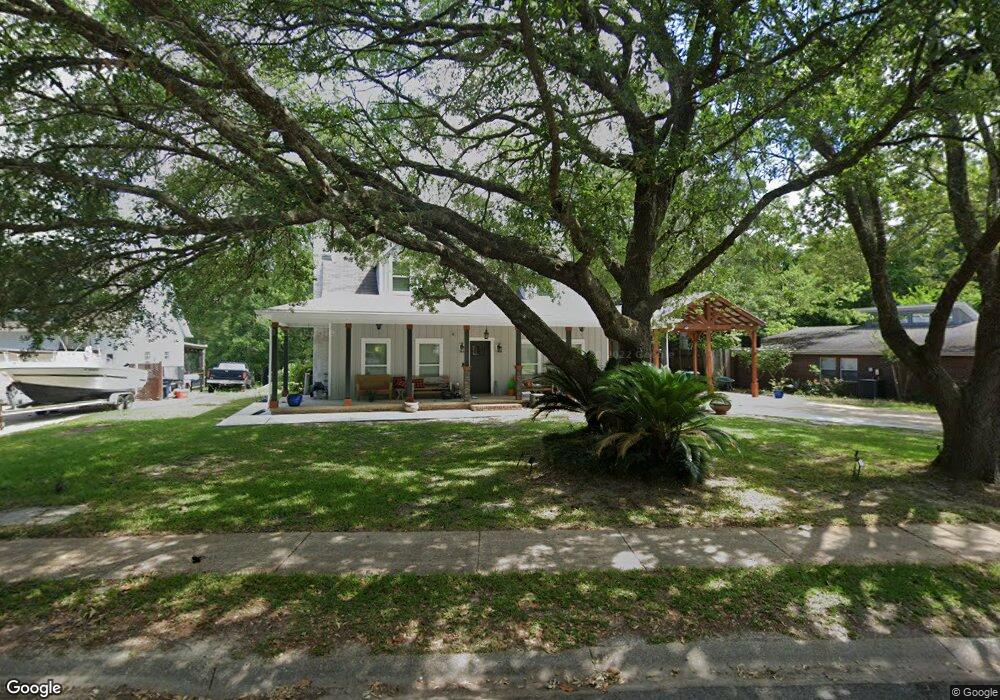
4001 Breezy Hill Ln Ocean Springs, MS 39564
Estimated Value: $301,000 - $378,000
--
Bed
3
Baths
2,042
Sq Ft
$168/Sq Ft
Est. Value
About This Home
This home is located at 4001 Breezy Hill Ln, Ocean Springs, MS 39564 and is currently estimated at $343,712, approximately $168 per square foot. 4001 Breezy Hill Ln is a home located in Jackson County with nearby schools including Magnolia Park Elementary School, Ocean Springs Middle School, and Ocean Springs High School.
Ownership History
Date
Name
Owned For
Owner Type
Purchase Details
Closed on
Jun 15, 2021
Sold by
Dickinson Gregory H and Dickinson Verna D
Bought by
Dickinson Grant H and Dickinson Monica
Current Estimated Value
Home Financials for this Owner
Home Financials are based on the most recent Mortgage that was taken out on this home.
Original Mortgage
$175,000
Outstanding Balance
$158,441
Interest Rate
2.9%
Mortgage Type
Stand Alone Refi Refinance Of Original Loan
Estimated Equity
$185,271
Purchase Details
Closed on
Aug 14, 2017
Bought by
Williams Kendrick and Williams Martha
Home Financials for this Owner
Home Financials are based on the most recent Mortgage that was taken out on this home.
Original Mortgage
$299,000
Interest Rate
3.9%
Purchase Details
Closed on
Mar 3, 2017
Sold by
Barthes Francis Joseph
Bought by
Dickinson Gregory H and Dickinson Verna D
Create a Home Valuation Report for This Property
The Home Valuation Report is an in-depth analysis detailing your home's value as well as a comparison with similar homes in the area
Home Values in the Area
Average Home Value in this Area
Purchase History
| Date | Buyer | Sale Price | Title Company |
|---|---|---|---|
| Dickinson Grant H | -- | None Available | |
| Williams Kendrick | -- | -- | |
| Dickinson Gregory H | -- | None Available |
Source: Public Records
Mortgage History
| Date | Status | Borrower | Loan Amount |
|---|---|---|---|
| Open | Dickinson Grant H | $175,000 | |
| Previous Owner | Williams Kendrick | $299,000 | |
| Previous Owner | Williams Kendrick | -- |
Source: Public Records
Tax History Compared to Growth
Tax History
| Year | Tax Paid | Tax Assessment Tax Assessment Total Assessment is a certain percentage of the fair market value that is determined by local assessors to be the total taxable value of land and additions on the property. | Land | Improvement |
|---|---|---|---|---|
| 2024 | $3,861 | $26,789 | $4,598 | $22,191 |
| 2023 | $3,861 | $26,789 | $4,598 | $22,191 |
| 2022 | $3,225 | $22,082 | $4,598 | $17,484 |
| 2021 | $3,193 | $22,178 | $4,598 | $17,580 |
| 2020 | $2,974 | $20,447 | $4,220 | $16,227 |
| 2019 | $2,962 | $20,447 | $4,220 | $16,227 |
| 2018 | $2,948 | $20,447 | $4,220 | $16,227 |
| 2017 | $1,665 | $13,631 | $2,813 | $10,818 |
| 2016 | $1,624 | $13,631 | $2,813 | $10,818 |
| 2015 | $1,557 | $129,110 | $28,130 | $100,980 |
| 2014 | $1,574 | $13,121 | $2,813 | $10,308 |
| 2013 | $1,531 | $13,121 | $2,813 | $10,308 |
Source: Public Records
Map
Nearby Homes
- 4003 Breezy Hill Ln
- 3123 Breezy Hill Ln
- 0 Breezy Hill Ln
- 000 Breezy Hill Ln
- 4005 Breezy Hill Ln
- 0 Breezy Unit 3268317
- 0 Breezy Unit 3323366
- 0 Breezy Unit 3353873
- 4002 Breezy Hill Ln
- 4004 Breezy Hill Ln
- 4000 Breezy Hill Ln
- 3119 Breezy Hill Ln
- 3500 Tyler St
- 4006 Breezy Hill Ln
- 1002 Brittany Cove
- 3501 Tyler St
- 3117 Breezy Hill Ln
- 4008 Breezy Hill Ln
- 1003 Brittany Cove
- 4009 Breezy Hill Ln