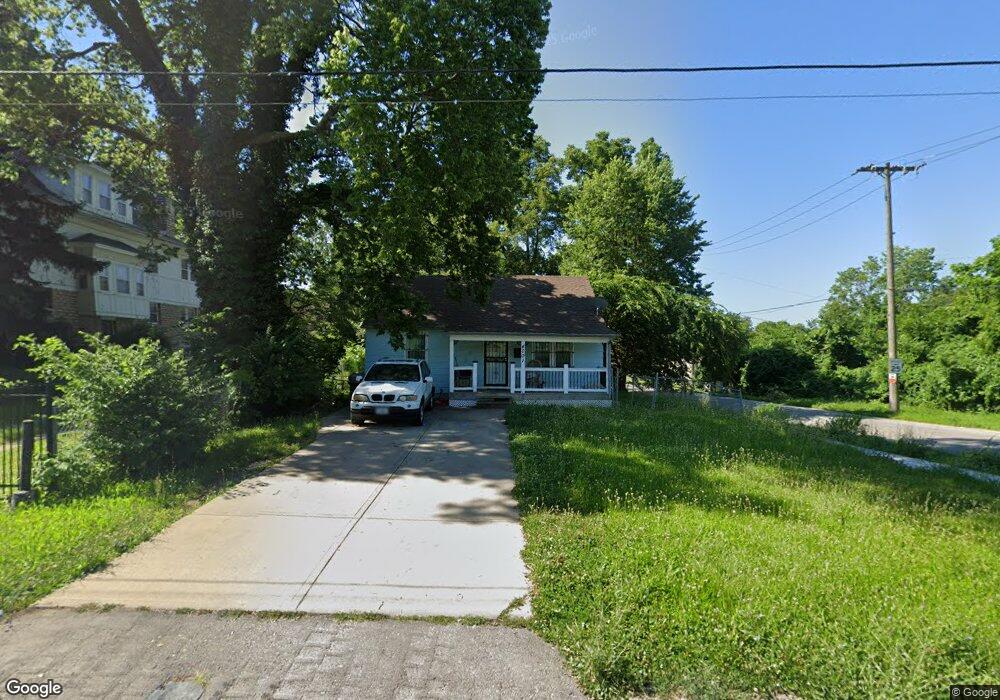
4001 E 67th St Kansas City, MO 64132
Foxtown East NeighborhoodEstimated Value: $83,172 - $118,000
2
Beds
1
Bath
750
Sq Ft
$131/Sq Ft
Est. Value
About This Home
This home is located at 4001 E 67th St, Kansas City, MO 64132 and is currently estimated at $98,543, approximately $131 per square foot. 4001 E 67th St is a home located in Jackson County with nearby schools including Benjamin Banneker Elementary School, Central Middle School, and Southeast High School.
Ownership History
Date
Name
Owned For
Owner Type
Purchase Details
Closed on
Jul 31, 2015
Sold by
John R Campbell Jr Llc
Bought by
Caldwell Markita and Kessel Victor R
Current Estimated Value
Purchase Details
Closed on
Apr 29, 2003
Sold by
Weaver Willis
Bought by
Edna M Bennett Trust
Home Financials for this Owner
Home Financials are based on the most recent Mortgage that was taken out on this home.
Original Mortgage
$27,000
Interest Rate
5.57%
Mortgage Type
Seller Take Back
Purchase Details
Closed on
Apr 28, 2003
Sold by
Edna M Bennett Trust
Bought by
Bruce Jackie
Home Financials for this Owner
Home Financials are based on the most recent Mortgage that was taken out on this home.
Original Mortgage
$27,000
Interest Rate
5.57%
Mortgage Type
Seller Take Back
Purchase Details
Closed on
Jul 15, 1996
Sold by
Weaver Mary N
Bought by
Weaver Willis
Create a Home Valuation Report for This Property
The Home Valuation Report is an in-depth analysis detailing your home's value as well as a comparison with similar homes in the area
Home Values in the Area
Average Home Value in this Area
Purchase History
| Date | Buyer | Sale Price | Title Company |
|---|---|---|---|
| Caldwell Markita | -- | None Available | |
| Edna M Bennett Trust | -- | -- | |
| Bruce Jackie | -- | Metro One Title | |
| Weaver Willis | -- | -- | |
| Weaver Willis | -- | -- |
Source: Public Records
Mortgage History
| Date | Status | Borrower | Loan Amount |
|---|---|---|---|
| Previous Owner | Bruce Jackie | $27,000 |
Source: Public Records
Tax History Compared to Growth
Tax History
| Year | Tax Paid | Tax Assessment Tax Assessment Total Assessment is a certain percentage of the fair market value that is determined by local assessors to be the total taxable value of land and additions on the property. | Land | Improvement |
|---|---|---|---|---|
| 2025 | $600 | $5,778 | $2,147 | $3,631 |
| 2024 | $594 | $7,600 | $1,630 | $5,970 |
| 2023 | $594 | $7,600 | $901 | $6,699 |
| 2022 | $359 | $4,370 | $1,843 | $2,527 |
| 2021 | $358 | $4,370 | $1,843 | $2,527 |
| 2020 | $365 | $4,402 | $1,843 | $2,559 |
| 2019 | $358 | $4,402 | $1,843 | $2,559 |
| 2018 | $390 | $4,904 | $765 | $4,139 |
| 2017 | $390 | $4,904 | $765 | $4,139 |
| 2016 | $383 | $4,781 | $807 | $3,974 |
| 2014 | $459 | $4,781 | $807 | $3,974 |
Source: Public Records
Map
Nearby Homes
- 6745 Cleveland Ave
- 3822 E 68th Terrace
- 4015 E 68th Terrace
- 4225 E 68th St
- 6610 Askew Ave
- 3503 E 67th St
- 6727 Bales Ave
- 6656 Bales Ave
- 6821 Bales Ave
- 7004 Jackson Ave
- 7012 Jackson Ave
- 6701 Walrond Ave
- 3114 E 68th St
- 3874 E 63rd St
- 6942 College Ave
- 6435 Walrond Ave
- 7015 College Ave
- 6933 Walrond Ave
- 6328 Indiana Ave
- 3440 E 63rd St
- 4007 E 67th St
- 4015 E 67th St
- 6708 Myrtle Ave
- 4021 E 67th St
- 6716 Myrtle Ave
- 4014 E 67th Terrace
- 3838 E 67th Terrace
- 4018 E 67th Terrace
- 4016 E 67th Terrace
- 3838 E 67th Terrace
- 3830 E 67th Terrace
- 3834 E 67th Terrace
- 4025 E 67th St
- 6727 Myrtle Ave
- 3843 E 67th Terrace
- 3839 E 67th Terrace
- 3828 E 67th Terrace
- 3837 E 67th Terrace
- 6731 Myrtle Ave
- 4011 E 67th Terrace