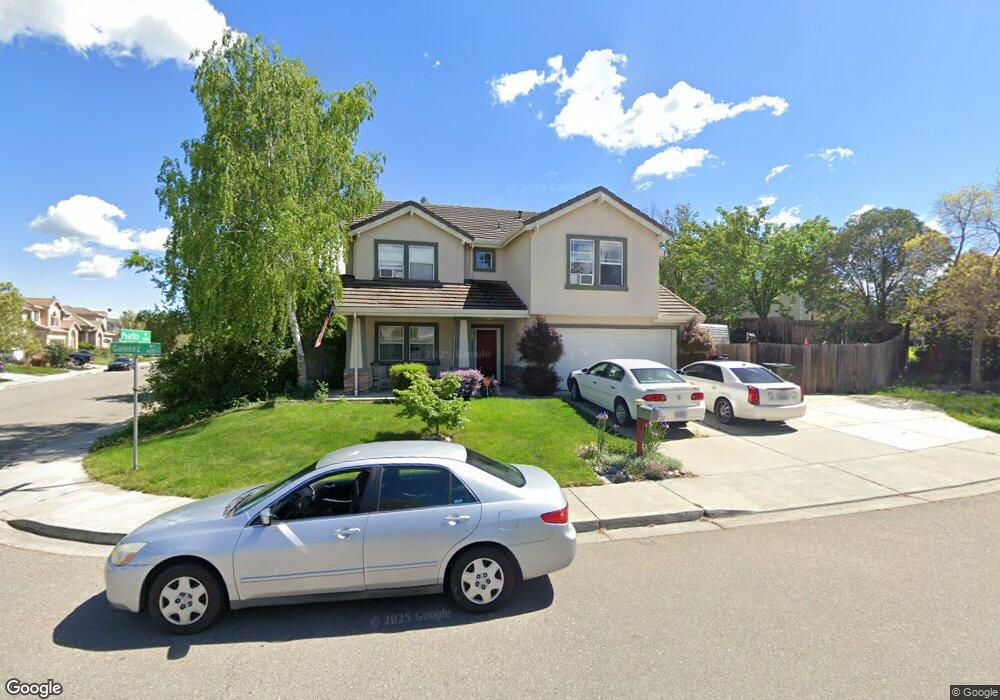
4001 Galenez Way Antioch, CA 94531
Deer Valley NeighborhoodEstimated Value: $714,177 - $817,000
4
Beds
3
Baths
2,653
Sq Ft
$280/Sq Ft
Est. Value
About This Home
This home is located at 4001 Galenez Way, Antioch, CA 94531 and is currently estimated at $743,044, approximately $280 per square foot. 4001 Galenez Way is a home located in Contra Costa County with nearby schools including Jack London Elementary School, Black Diamond Middle School, and Deer Valley High School.
Ownership History
Date
Name
Owned For
Owner Type
Purchase Details
Closed on
Jul 18, 2014
Sold by
Westhorpe Kendal and Westhorpe Jennifer
Bought by
Utman Andrew T
Current Estimated Value
Home Financials for this Owner
Home Financials are based on the most recent Mortgage that was taken out on this home.
Original Mortgage
$391,773
Outstanding Balance
$298,414
Interest Rate
4.16%
Mortgage Type
FHA
Estimated Equity
$444,630
Purchase Details
Closed on
Jul 18, 2011
Sold by
Westhorpe Ken and Westhorpe Jennifer
Bought by
Westhorpe Kendall R and Westhorpe Jennifer
Purchase Details
Closed on
Jul 30, 1998
Sold by
Colony At Deer Valley Lp
Bought by
Westhorpe Ken and Westhorpe Jennifer
Home Financials for this Owner
Home Financials are based on the most recent Mortgage that was taken out on this home.
Original Mortgage
$163,550
Interest Rate
6.9%
Mortgage Type
Purchase Money Mortgage
Create a Home Valuation Report for This Property
The Home Valuation Report is an in-depth analysis detailing your home's value as well as a comparison with similar homes in the area
Home Values in the Area
Average Home Value in this Area
Purchase History
| Date | Buyer | Sale Price | Title Company |
|---|---|---|---|
| Utman Andrew T | $399,000 | Old Republic Title Company | |
| Westhorpe Kendall R | -- | None Available | |
| Westhorpe Ken | $204,500 | North American Title |
Source: Public Records
Mortgage History
| Date | Status | Borrower | Loan Amount |
|---|---|---|---|
| Open | Utman Andrew T | $391,773 | |
| Previous Owner | Westhorpe Ken | $163,550 | |
| Closed | Westhorpe Ken | $14,800 |
Source: Public Records
Tax History Compared to Growth
Tax History
| Year | Tax Paid | Tax Assessment Tax Assessment Total Assessment is a certain percentage of the fair market value that is determined by local assessors to be the total taxable value of land and additions on the property. | Land | Improvement |
|---|---|---|---|---|
| 2025 | $5,563 | $479,529 | $132,199 | $347,330 |
| 2024 | $5,365 | $470,127 | $129,607 | $340,520 |
| 2023 | $5,365 | $460,910 | $127,066 | $333,844 |
| 2022 | $5,282 | $451,874 | $124,575 | $327,299 |
| 2021 | $5,125 | $443,015 | $122,133 | $320,882 |
| 2019 | $5,013 | $429,876 | $118,511 | $311,365 |
| 2018 | $4,825 | $421,448 | $116,188 | $305,260 |
| 2017 | $4,727 | $413,185 | $113,910 | $299,275 |
| 2016 | $4,616 | $405,084 | $111,677 | $293,407 |
| 2015 | $4,911 | $399,000 | $110,000 | $289,000 |
| 2014 | $4,549 | $273,216 | $63,938 | $209,278 |
Source: Public Records
Map
Nearby Homes
- 4008 Galenez Way
- 4030 Sheffield Dr
- 941 Bluerock Dr
- 924 Flintrock Dr
- 921 Clay Ct
- 4204 Limestone Dr
- 820 Carpinteria Dr
- 2387 Whitetail Dr
- 4305 Calsite Ct
- 2603 Asilomar Dr
- 2794 Lily Ct
- 2404 Whitetail Dr
- 2640 Point Andrus Ct
- 2827 Heather Heights Ct
- 3121 Ferngrove Way
- 2803 Winding Ln
- 409 Agate Ct
- 2705 Asilomar Dr
- 2829 Winding Ln Unit Upper
- 2933 Winding Ln Unit 75
- 4017 Galenez Way
- 2410 Pearlite Way
- 4021 Galenez Way
- 2405 Pearlite Way
- 2414 Pearlite Way
- 2409 Pearlite Way
- 4000 Galenez Way
- 4025 Galenez Way
- 4004 Galenez Way
- 2401 Pearlite Way
- 4012 Galenez Way
- 2413 Pearlite Way
- 2418 Pearlite Way
- 4016 Galenez Way
- 4029 Galenez Way
- 2329 Pearlite Ct
- 2417 Pearlite Way
- 4020 Galenez Way
- 2305 Pearlite Ct
- 2422 Pearlite Way