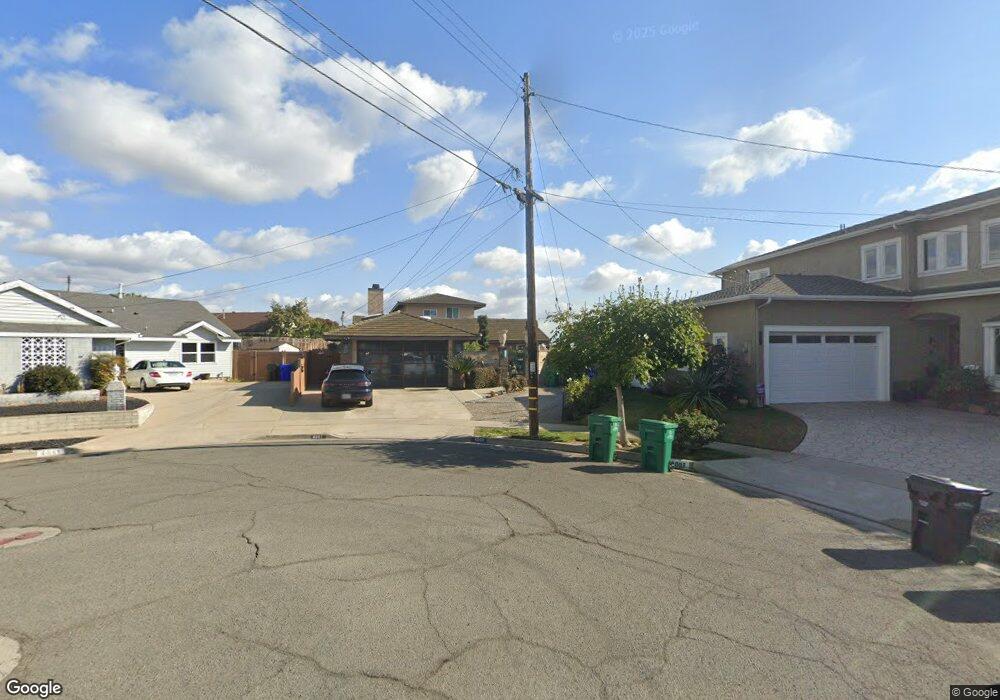
4001 Mount Terminus Dr San Diego, CA 92111
Clairemont Mesa West NeighborhoodEstimated Value: $788,000 - $1,350,000
5
Beds
4
Baths
3,782
Sq Ft
$283/Sq Ft
Est. Value
About This Home
This home is located at 4001 Mount Terminus Dr, San Diego, CA 92111 and is currently estimated at $1,069,000, approximately $282 per square foot. 4001 Mount Terminus Dr is a home located in San Diego County with nearby schools including Holmes Elementary, Marston Middle School, and Clairemont High School.
Ownership History
Date
Name
Owned For
Owner Type
Purchase Details
Closed on
May 25, 2021
Sold by
Boeh David Anthony
Bought by
Boeh David Anthony and David A Boeh Trust
Current Estimated Value
Purchase Details
Closed on
Aug 22, 2019
Sold by
Boeh David A and Boeh Toni G
Bought by
Boeh David Anthony
Purchase Details
Closed on
Aug 14, 2009
Sold by
Wells Fargo Bank Na
Bought by
Boeh David A and Boeh Toni G
Home Financials for this Owner
Home Financials are based on the most recent Mortgage that was taken out on this home.
Original Mortgage
$400,000
Outstanding Balance
$259,201
Interest Rate
5.09%
Mortgage Type
Purchase Money Mortgage
Estimated Equity
$809,799
Purchase Details
Closed on
Oct 11, 1993
Sold by
Brooks Arthur J
Bought by
Brooks Arthur Julius
Home Financials for this Owner
Home Financials are based on the most recent Mortgage that was taken out on this home.
Original Mortgage
$271,000
Interest Rate
6.94%
Purchase Details
Closed on
Jul 27, 1987
Create a Home Valuation Report for This Property
The Home Valuation Report is an in-depth analysis detailing your home's value as well as a comparison with similar homes in the area
Home Values in the Area
Average Home Value in this Area
Purchase History
| Date | Buyer | Sale Price | Title Company |
|---|---|---|---|
| Boeh David Anthony | -- | None Available | |
| Boeh David Anthony | -- | Equity Title San Diego | |
| Boeh David A | -- | Chicago Title Company | |
| Brooks Arthur Julius | -- | Fidelity National Title | |
| Brooks Arthur J | -- | Fidelity National Title | |
| -- | $152,000 | -- |
Source: Public Records
Mortgage History
| Date | Status | Borrower | Loan Amount |
|---|---|---|---|
| Open | Boeh David A | $400,000 | |
| Previous Owner | Brooks Arthur J | $271,000 |
Source: Public Records
Tax History Compared to Growth
Tax History
| Year | Tax Paid | Tax Assessment Tax Assessment Total Assessment is a certain percentage of the fair market value that is determined by local assessors to be the total taxable value of land and additions on the property. | Land | Improvement |
|---|---|---|---|---|
| 2025 | $11,117 | $927,519 | $425,965 | $501,554 |
| 2024 | $11,117 | $909,333 | $417,613 | $491,720 |
| 2023 | $10,870 | $891,504 | $409,425 | $482,079 |
| 2022 | $8,292 | $686,025 | $401,398 | $284,627 |
| 2021 | $8,234 | $672,575 | $393,528 | $279,047 |
| 2020 | $8,133 | $665,679 | $389,493 | $276,186 |
| 2019 | $7,987 | $652,627 | $381,856 | $270,771 |
| 2018 | $7,466 | $639,831 | $374,369 | $265,462 |
| 2017 | $80 | $627,286 | $367,029 | $260,257 |
| 2016 | $7,169 | $614,987 | $359,833 | $255,154 |
| 2015 | $7,062 | $605,750 | $354,428 | $251,322 |
| 2014 | $6,950 | $593,885 | $347,486 | $246,399 |
Source: Public Records
Map
Nearby Homes
- 4695 Mount Armet Dr
- 4141 Mount Bigelow Way
- 3855 Mount Blackburn Ave
- 4870 Mount Armour Dr
- 3567 Mount Everest Blvd
- 3652 Clairemont Dr Unit 1B
- 4226 Mount Voss Dr
- 3432 Mount Ariane Dr
- 4840 Canyon View
- C1 Plan at Mira Vista
- C5 Plan at Mira Vista
- 4527 Misty Place
- 4517 Misty Place
- 4511 Misty Place
- 4731 Misty Place
- 4741 Misty Place
- 5252 Mount Blanca Dr
- 4407 Dakota Dr
- 5289 Mount Alifan Dr
- 3942 Mount Acadia Blvd
- 4011 Mount Terminus Dr
- 4002 Mount Terminus Dr
- 4006 Mount Alifan Way
- 4026 Mount Alifan Way
- 4403 Mount Alifan Dr
- 4014 Mount Terminus Dr
- 4415 Mount Alifan Dr
- 4005 Mount Alifan Way
- 4046 Mount Alifan Way
- 4026 Mount Terminus Dr
- 4034 Mount Terminus Dr
- 4015 Mount Alifan Way
- 4029 Mount Alifan Way
- 4455 Mount Alifan Dr
- 4046 Mount Terminus Dr
- 4402 Mount Alifan Dr
- 4414 Mount Alifan Dr
- 4469 Mount Alifan Dr
- 4058 Mount Terminus Dr
- 4440 Mount Alifan Dr