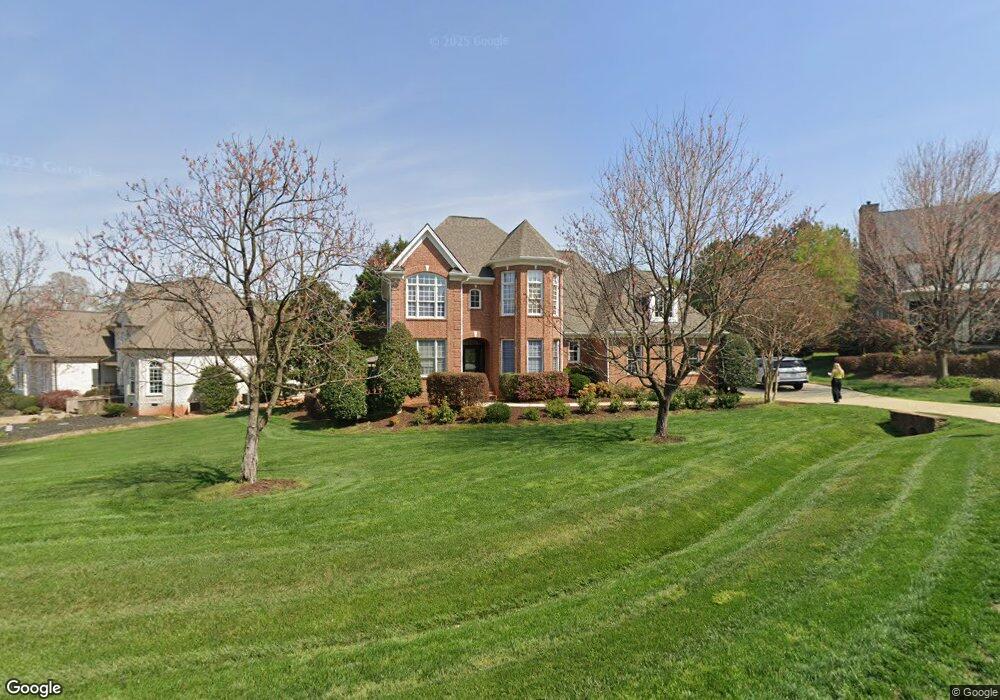
4001 Sorrell Brothers Ct Unit lot25 Raleigh, NC 27603
Estimated Value: $843,850 - $887,000
4
Beds
5
Baths
3,746
Sq Ft
$233/Sq Ft
Est. Value
About This Home
This home is located at 4001 Sorrell Brothers Ct Unit lot25, Raleigh, NC 27603 and is currently estimated at $872,213, approximately $232 per square foot. 4001 Sorrell Brothers Ct Unit lot25 is a home located in Wake County with nearby schools including Banks Road Elementary School.
Ownership History
Date
Name
Owned For
Owner Type
Purchase Details
Closed on
Nov 19, 2020
Sold by
Snyder Paul D and Snyder Charo
Bought by
Wolfe Richard J and Wolfe Krystal R
Current Estimated Value
Home Financials for this Owner
Home Financials are based on the most recent Mortgage that was taken out on this home.
Original Mortgage
$468,000
Outstanding Balance
$416,454
Interest Rate
2.8%
Mortgage Type
New Conventional
Estimated Equity
$455,760
Purchase Details
Closed on
Nov 30, 2007
Sold by
Reese Construction Llc
Bought by
Snyder Paul D
Home Financials for this Owner
Home Financials are based on the most recent Mortgage that was taken out on this home.
Original Mortgage
$417,000
Interest Rate
6.36%
Mortgage Type
Purchase Money Mortgage
Create a Home Valuation Report for This Property
The Home Valuation Report is an in-depth analysis detailing your home's value as well as a comparison with similar homes in the area
Home Values in the Area
Average Home Value in this Area
Purchase History
| Date | Buyer | Sale Price | Title Company |
|---|---|---|---|
| Wolfe Richard J | $585,000 | None Available | |
| Snyder Paul D | $560,000 | None Available |
Source: Public Records
Mortgage History
| Date | Status | Borrower | Loan Amount |
|---|---|---|---|
| Open | Wolfe Richard J | $468,000 | |
| Previous Owner | Snyder Paul D | $417,000 | |
| Previous Owner | Snyder Paul D | $30,000 |
Source: Public Records
Tax History Compared to Growth
Tax History
| Year | Tax Paid | Tax Assessment Tax Assessment Total Assessment is a certain percentage of the fair market value that is determined by local assessors to be the total taxable value of land and additions on the property. | Land | Improvement |
|---|---|---|---|---|
| 2025 | $5,133 | $799,423 | $140,000 | $659,423 |
| 2024 | $4,984 | $799,423 | $140,000 | $659,423 |
| 2023 | $4,406 | $562,579 | $75,000 | $487,579 |
| 2022 | $4,083 | $562,579 | $75,000 | $487,579 |
| 2021 | $3,973 | $562,579 | $75,000 | $487,579 |
| 2020 | $3,907 | $562,579 | $75,000 | $487,579 |
| 2019 | $4,027 | $490,668 | $75,000 | $415,668 |
| 2018 | $3,702 | $490,668 | $75,000 | $415,668 |
| 2017 | $3,509 | $490,668 | $75,000 | $415,668 |
| 2016 | $3,438 | $490,668 | $75,000 | $415,668 |
| 2015 | $3,895 | $557,980 | $92,000 | $465,980 |
| 2014 | -- | $557,980 | $92,000 | $465,980 |
Source: Public Records
Map
Nearby Homes
- 9045 Chelsea Dr
- 9008 Chelsea Dr
- 3320 Highgate Rd
- 3205 Banks Rd
- 10329 Fanny Brown Rd
- 3616 Cross Timber Ln
- 3112 Constance Cir
- 9812 Chris Dr
- 2029 Howson Rd
- 3324 Air Park Rd
- 1320 Taylor Farm Rd
- 2032 Stonepond Ln
- 4620 Cresta Dr
- 4824 Bristol Meadow Dr
- 5216 Relay Way
- 51 Cheshire Downs Ct
- 5817 Shedd Dr
- 5060 Trotter Dr
- 1329 Wynncrest Ct
- 4705 Trotter Dr
- 4001 Sorrell Brothers Ct
- 4005 Sorrell Brothers Ct
- 9017 Chelsea Dr
- 4012 Sorrell Brothers Ct
- 9033 Chelsea Dr
- 4000 Sorrell Brothers Ct
- 9013 Chelsea Dr
- 9005 Chelsea Dr
- 4004 Sorrell Brothers Ct
- 9001 Chelsea Dr
- 4008 Sorrell Brothers Ct
- 9037 Chelsea Dr
- 4001 Bankshire Ln
- 4001 Bankshire Ln Unit 10
- 3313 Banks Rd
- 3317 Banks Rd
- 3309 Banks Rd
- 9020 Chelsea Dr
- 9016 Chelsea Dr
- 9024 Chelsea Dr