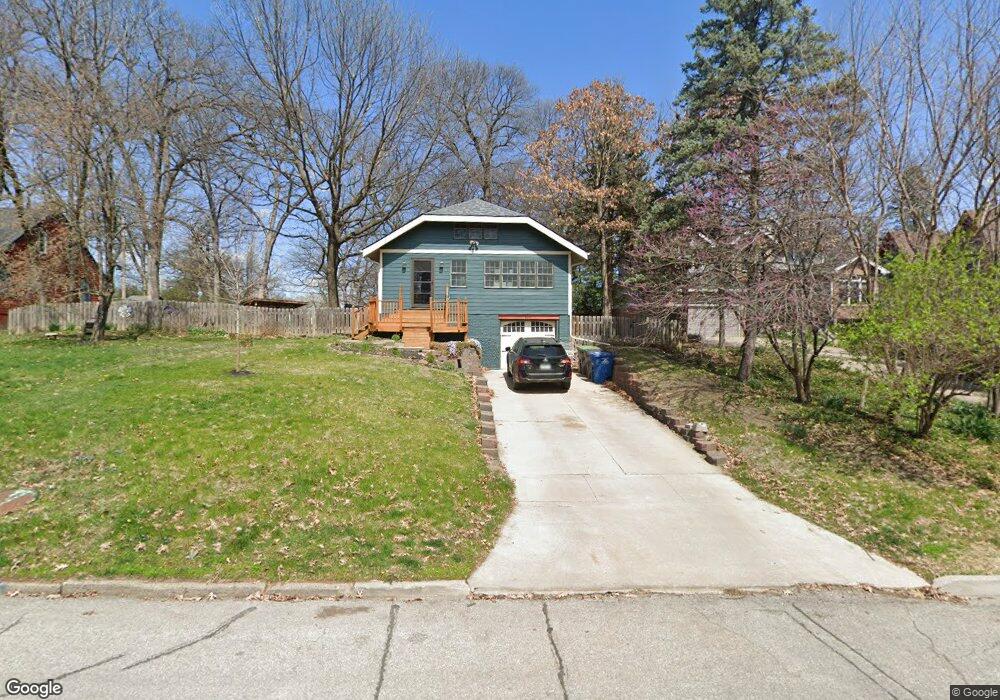
4001 Welker Ave Des Moines, IA 50312
Salisbury Oaks NeighborhoodEstimated Value: $224,000 - $436,000
2
Beds
2
Baths
1,144
Sq Ft
$249/Sq Ft
Est. Value
About This Home
This home is located at 4001 Welker Ave, Des Moines, IA 50312 and is currently estimated at $284,950, approximately $249 per square foot. 4001 Welker Ave is a home located in Polk County with nearby schools including Greenwood Elementary School, Callanan Middle School, and Roosevelt High School.
Ownership History
Date
Name
Owned For
Owner Type
Purchase Details
Closed on
Apr 16, 2008
Sold by
Holderness Joshua A and Holderness Shara D
Bought by
Holderness Joshua A and Garner Holderness Shara D
Current Estimated Value
Purchase Details
Closed on
Jul 15, 2004
Sold by
Federal National Mortgage Association
Bought by
S & G Real Estate Investments Inc
Home Financials for this Owner
Home Financials are based on the most recent Mortgage that was taken out on this home.
Original Mortgage
$119,800
Outstanding Balance
$60,632
Interest Rate
6.42%
Mortgage Type
Construction
Estimated Equity
$224,318
Purchase Details
Closed on
May 14, 2004
Sold by
Wells Fargo Bank Na
Bought by
Federal National Mortgage Association
Purchase Details
Closed on
May 3, 2004
Sold by
Bray Dennis J
Bought by
Wells Fargo Home Mortgage Inc
Create a Home Valuation Report for This Property
The Home Valuation Report is an in-depth analysis detailing your home's value as well as a comparison with similar homes in the area
Home Values in the Area
Average Home Value in this Area
Purchase History
| Date | Buyer | Sale Price | Title Company |
|---|---|---|---|
| Holderness Joshua A | -- | None Available | |
| S & G Real Estate Investments Inc | -- | -- | |
| Federal National Mortgage Association | -- | -- | |
| Wells Fargo Home Mortgage Inc | -- | -- |
Source: Public Records
Mortgage History
| Date | Status | Borrower | Loan Amount |
|---|---|---|---|
| Open | S & G Real Estate Investments Inc | $119,800 |
Source: Public Records
Tax History
| Year | Tax Paid | Tax Assessment Tax Assessment Total Assessment is a certain percentage of the fair market value that is determined by local assessors to be the total taxable value of land and additions on the property. | Land | Improvement |
|---|---|---|---|---|
| 2025 | $3,684 | $222,500 | $42,600 | $179,900 |
| 2024 | $3,684 | $197,700 | $37,800 | $159,900 |
| 2023 | $3,692 | $197,700 | $37,800 | $159,900 |
| 2022 | $3,662 | $165,500 | $32,700 | $132,800 |
| 2021 | $3,554 | $165,500 | $32,700 | $132,800 |
| 2020 | $3,686 | $151,000 | $30,000 | $121,000 |
| 2019 | $3,410 | $151,000 | $30,000 | $121,000 |
| 2018 | $3,370 | $135,400 | $26,700 | $108,700 |
| 2017 | $2,998 | $135,400 | $26,700 | $108,700 |
| 2016 | $2,916 | $119,400 | $23,300 | $96,100 |
| 2015 | $2,916 | $119,400 | $23,300 | $96,100 |
| 2014 | $2,170 | $113,400 | $22,100 | $91,300 |
Source: Public Records
Map
Nearby Homes
- 200 SW 42nd St
- 115 Tonawanda Dr
- 3939 River Oaks Dr
- 576 & 578 SW 42nd St
- 3545 Lincoln Place Dr
- 321 43rd St
- 3930 Grand Ave Unit 402
- 3930 Grand Ave Unit 306
- 3930 Grand Ave Unit 4GN
- 3930 Grand Ave Unit 308
- 635 Foster Dr
- 415 42nd St
- 4004 Grand Ave Unit 103
- 3225 Terrace Dr
- 3750 Grand Ave Unit 501
- 3920 Grand Ave Unit 2TW
- 3920 Grand Ave Unit 5TE
- 4345 Grand Ave Unit 3
- 3667 Grand Ave Unit 2
- 4323 Grand Ave Unit 103
- 3943 Welker Ave
- 4005 Welker Ave
- 3939 Welker Ave
- 3937 Welker Ave
- 4021 Welker Ave
- 4002 Welker Ave
- 3938 Welker Ave
- 3934 Welker Ave
- 4025 Welker Ave
- 4012 John Lynde Rd
- 4010 Welker Ave
- 3915 Welker Ave
- 4027 Welker Ave
- 4020 John Lynde Rd
- 4029 Welker Ave
- 3943 Lincoln Place Dr
- 3909 Welker Ave
- 3935 Lincoln Place Dr
- 4028 Welker Ave
- 3920 Welker Ave
Your Personal Tour Guide
Ask me questions while you tour the home.