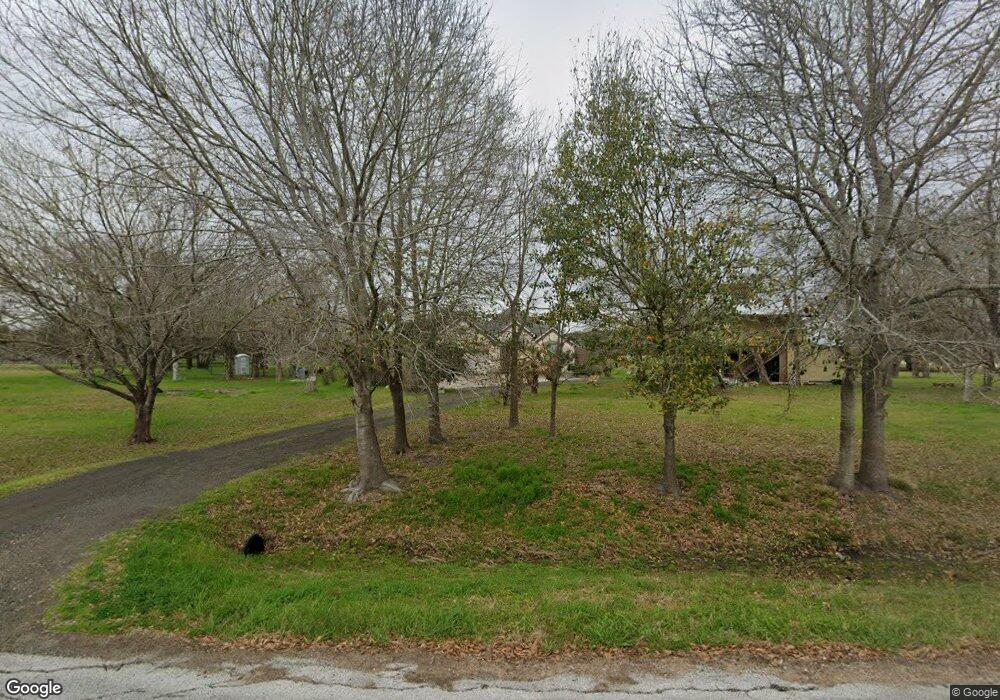
4002 Hartledge Rd Rosenberg, TX 77471
Estimated Value: $379,000 - $484,000
3
Beds
3
Baths
1,857
Sq Ft
$223/Sq Ft
Est. Value
About This Home
This home is located at 4002 Hartledge Rd, Rosenberg, TX 77471 and is currently estimated at $414,321, approximately $223 per square foot. 4002 Hartledge Rd is a home with nearby schools including Beasley Elementary School, George Junior High School, and B.F. Terry High School.
Ownership History
Date
Name
Owned For
Owner Type
Purchase Details
Closed on
Jun 5, 2025
Sold by
Solis Anna E and Christopoulos Anna Solis
Bought by
Solis Benjamin
Current Estimated Value
Purchase Details
Closed on
May 13, 2021
Sold by
Patterson Jeremiah
Bought by
Opendoor Property Trust
Purchase Details
Closed on
Apr 14, 2010
Sold by
Sheppard Real Estate Consultants Inc
Bought by
Solis Anna E
Purchase Details
Closed on
Jan 5, 2010
Sold by
Compean Dolores
Bought by
Solis Anna Elizabeth
Purchase Details
Closed on
Jul 29, 2005
Sold by
Webb Daniel
Bought by
Webb Sonya
Purchase Details
Closed on
Aug 5, 2002
Sold by
K&M Home Builders Inc
Bought by
Solis Anna Elizabeth
Purchase Details
Closed on
Jun 12, 2002
Sold by
K & M Home Builders Inc
Bought by
Compean Dolores
Purchase Details
Closed on
Jul 25, 1997
Sold by
K & M Home Builders Inc
Bought by
Mellon Harry and Mellon Sidney
Create a Home Valuation Report for This Property
The Home Valuation Report is an in-depth analysis detailing your home's value as well as a comparison with similar homes in the area
Home Values in the Area
Average Home Value in this Area
Purchase History
| Date | Buyer | Sale Price | Title Company |
|---|---|---|---|
| Solis Benjamin | -- | None Listed On Document | |
| Opendoor Property Trust | -- | None Listed On Document | |
| Solis Anna E | -- | Stewart Title Richmond | |
| Solis Anna Elizabeth | -- | -- | |
| Webb Sonya | -- | -- | |
| Solis Anna Elizabeth | -- | -- | |
| Compean Dolores | -- | -- | |
| Mellon Harry | -- | -- |
Source: Public Records
Tax History
| Year | Tax Paid | Tax Assessment Tax Assessment Total Assessment is a certain percentage of the fair market value that is determined by local assessors to be the total taxable value of land and additions on the property. | Land | Improvement |
|---|---|---|---|---|
| 2025 | $7,832 | $423,713 | $169,459 | $254,254 |
| 2024 | $7,832 | $469,284 | $169,459 | $299,825 |
| 2023 | $7,832 | $456,587 | $56,803 | $399,784 |
| 2022 | $5,880 | $327,890 | $56,800 | $271,090 |
| 2021 | $4,409 | $245,660 | $56,800 | $188,860 |
| 2020 | $4,580 | $251,350 | $56,800 | $194,550 |
| 2019 | $4,832 | $247,280 | $56,800 | $190,480 |
| 2018 | $4,417 | $225,470 | $39,100 | $186,370 |
| 2017 | $4,192 | $213,420 | $39,100 | $174,320 |
| 2016 | $4,312 | $219,540 | $39,100 | $180,440 |
| 2015 | $4,474 | $226,390 | $39,100 | $187,290 |
| 2014 | $4,087 | $216,820 | $39,100 | $177,720 |
Source: Public Records
Map
Nearby Homes
- 00 Hartledge Rd
- 3819 Cottonwood School Rd
- 4440 Sims Rd
- 2607 Finney Vallet Rd
- 1626 Hartledge Rd
- 00 Kunz Rd
- 2606 Finney Vallet Rd
- 3402 Angus Farm Rd
- 3402 Angus Farm Dr
- 0 Kunz Rd
- 2127 Heather Ridge Way
- 3330 Hereford Dr
- 3326 Hereford Dr
- 3414 Everglade Ln
- 3410 Everglade Ln
- 4514 Whisperwood Dr
- 4523 Whisperwood Dr
- 4522 Whisperwood Dr
- 4519 Whisperwood Dr
- 1414 Hartledge Rd
- 4011 Scott Cir
- 4005 Scott Cir
- 4003 Stephen Cir
- 4018 Stephen Cir
- 4011 Stephen Cir
- 4019 Scott Cir
- 4111 Scott Cir
- 4004 Scott Cir
- 4018 Scott Cir
- 4111 Stephen Cir
- 4110 Scott Cir
- 4118 Stephen Cir
- 4119 Scott Cir
- 4118 Scott Cir
- 4126 Stephen Cir
- 4127 Scott Cir
- 2804 Hartledge Rd
- 2428 Hartledge Rd
- 4127 Stephen Cir
- 2805 Hartledge Rd
Your Personal Tour Guide
Ask me questions while you tour the home.