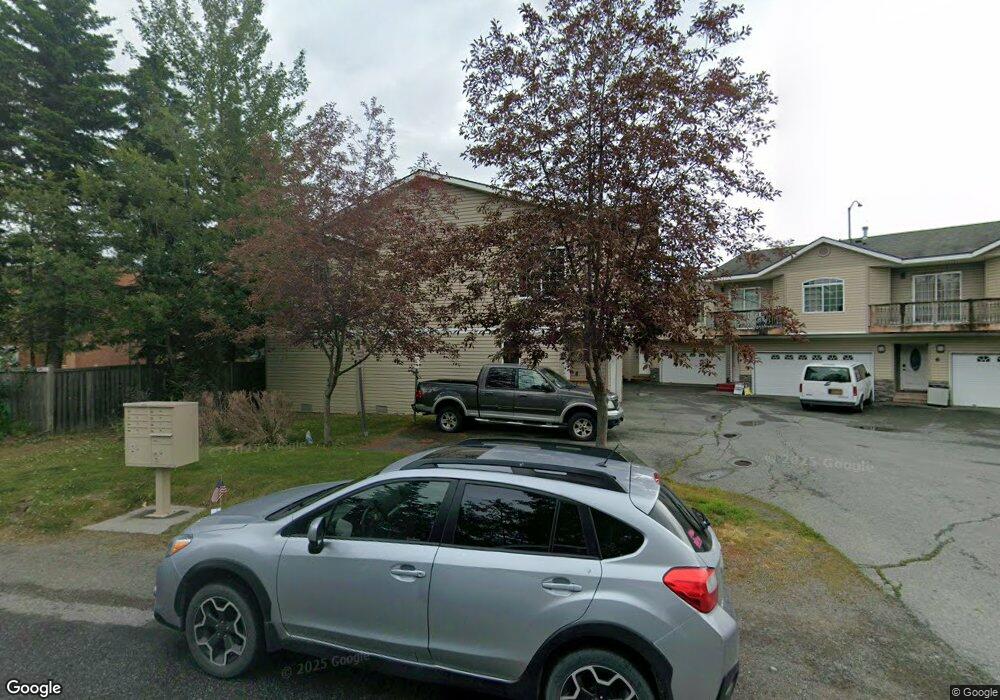
4002 Lakehurst Cir Unit 5 Anchorage, AK 99502
Sand Lake NeighborhoodEstimated Value: $186,000 - $353,667
3
Beds
2
Baths
1,588
Sq Ft
$187/Sq Ft
Est. Value
About This Home
This home is located at 4002 Lakehurst Cir Unit 5, Anchorage, AK 99502 and is currently estimated at $296,222, approximately $186 per square foot. 4002 Lakehurst Cir Unit 5 is a home located in Anchorage Municipality with nearby schools including Sand Lake Elementary, Mears Middle School, and Dimond High School.
Ownership History
Date
Name
Owned For
Owner Type
Purchase Details
Closed on
Jun 6, 2010
Sold by
Secretary Of Housing & Urban Development
Bought by
Perrins Chase Samuel
Current Estimated Value
Home Financials for this Owner
Home Financials are based on the most recent Mortgage that was taken out on this home.
Original Mortgage
$232,005
Outstanding Balance
$159,477
Interest Rate
5.5%
Mortgage Type
FHA
Estimated Equity
$136,745
Purchase Details
Closed on
Jan 25, 2010
Sold by
Wells Fargo Bank Na
Bought by
The Secretary Of Housing & Urban Develop
Purchase Details
Closed on
Jan 22, 2010
Sold by
Hamlin Jones L
Bought by
Wells Fargo Bank Na
Purchase Details
Closed on
Jan 10, 2008
Sold by
Bengal Groups Llc
Bought by
Hamlin Jonas L
Home Financials for this Owner
Home Financials are based on the most recent Mortgage that was taken out on this home.
Original Mortgage
$231,369
Interest Rate
6.05%
Mortgage Type
FHA
Create a Home Valuation Report for This Property
The Home Valuation Report is an in-depth analysis detailing your home's value as well as a comparison with similar homes in the area
Home Values in the Area
Average Home Value in this Area
Purchase History
| Date | Buyer | Sale Price | Title Company |
|---|---|---|---|
| Perrins Chase Samuel | -- | Sta | |
| The Secretary Of Housing & Urban Develop | -- | None Available | |
| Wells Fargo Bank Na | $246,246 | None Available | |
| Hamlin Jonas L | -- | Stewart |
Source: Public Records
Mortgage History
| Date | Status | Borrower | Loan Amount |
|---|---|---|---|
| Open | Perrins Chase Samuel | $232,005 | |
| Previous Owner | Hamlin Jonas L | $231,369 |
Source: Public Records
Tax History Compared to Growth
Tax History
| Year | Tax Paid | Tax Assessment Tax Assessment Total Assessment is a certain percentage of the fair market value that is determined by local assessors to be the total taxable value of land and additions on the property. | Land | Improvement |
|---|---|---|---|---|
| 2025 | $4,916 | $331,300 | -- | $331,300 |
| 2024 | $4,916 | $304,473 | $0 | $304,473 |
| 2023 | $4,671 | $274,300 | $0 | $274,300 |
| 2022 | $4,330 | $257,100 | $0 | $257,100 |
| 2021 | $4,644 | $257,700 | $0 | $257,700 |
| 2020 | $3,932 | $231,300 | $0 | $231,300 |
| 2019 | $3,871 | $236,600 | $0 | $236,600 |
| 2018 | $4,016 | $244,900 | $0 | $244,900 |
| 2017 | $3,395 | $236,800 | $0 | $236,800 |
| 2016 | $2,930 | $234,900 | $0 | $234,900 |
| 2015 | $2,930 | $237,900 | $0 | $237,900 |
| 2014 | $2,930 | $235,900 | $0 | $235,900 |
Source: Public Records
Map
Nearby Homes
- 4032 Hale Ct
- 9122 Lakehurst Dr
- 3801 Runestad Cir
- 8823 Jewel Terrace St
- L13 Quartz Cir
- L11 Quartz Cir
- Lot 6 Quartz Cir
- Lot 9 Quartz Cir
- Lot 8 Quartz Cir
- 3769 Quartz Cir
- St Elias 2335 Plan at Ruby Estates
- Fairfield 1884 Plan at Ruby Estates
- L7 Molanary Dr
- L8 Molanary Dr
- L3 Molanary Dr
- LOT 2 Quartz Cir
- 4341 Edinburgh Dr
- 3505 Alamosa Dr
- 4530 Macalister Dr
- 3806 N Point Cir
- 4002 Lakehurst Cir Unit 8
- 4002 Lakehurst Cir Unit 7
- 4002 Lakehurst Cir Unit 6
- 4002 Lakehurst Cir Unit 4
- 4002 Lakehurst Cir Unit 3
- 4002 Lakehurst Cir Unit 2
- 4002 Lakehurst Cir
- 4009 Lakehurst Cir
- 4026 Lakehurst Cir
- 4025 Lakehurst Cir
- 3951 Lakehurst Cir
- 3949 Lakehurst Cir
- 3949 Lakehurst Cir Unit 2
- 4040 Lakehurst Cir
- 9170 Jewel Lake Rd Unit 101
- 9170 Jewel Lake Rd Unit 104
- 9170 Jewel Lake Rd Unit 100
- 9170 Jewel Lake Rd
- L17 B1 Lakehurst Cir
- L18 B1 Lakehurst Cir