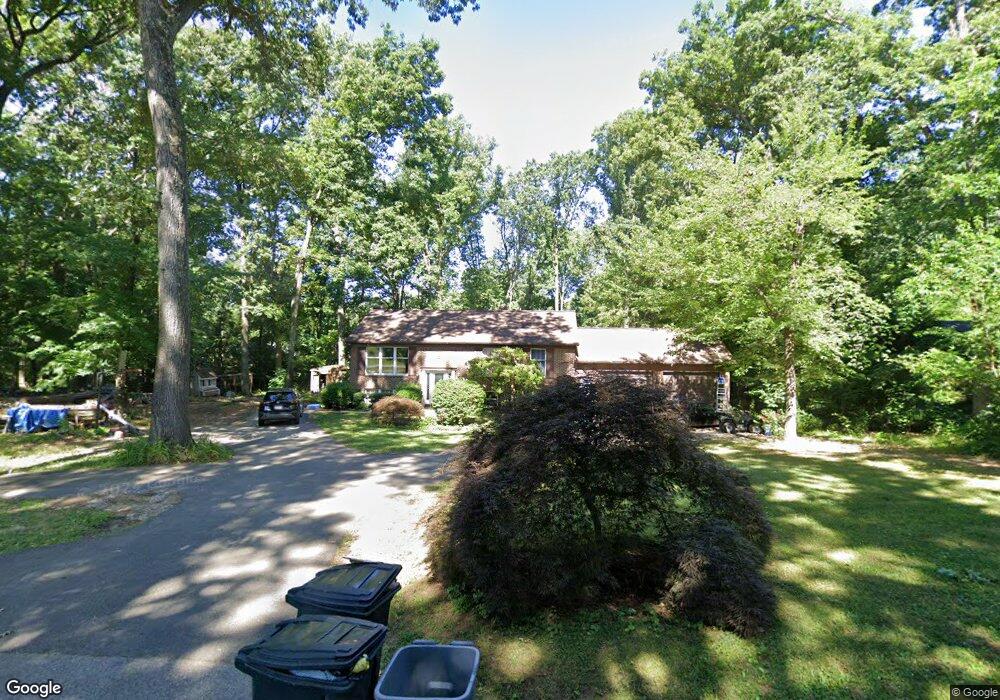
4002 Old York Rd Monkton, MD 21111
Estimated Value: $475,274 - $642,000
--
Bed
3
Baths
1,122
Sq Ft
$505/Sq Ft
Est. Value
About This Home
This home is located at 4002 Old York Rd, Monkton, MD 21111 and is currently estimated at $567,069, approximately $505 per square foot. 4002 Old York Rd is a home located in Harford County with nearby schools including Jarrettsville Elementary School, North Harford Middle School, and North Harford High School.
Ownership History
Date
Name
Owned For
Owner Type
Purchase Details
Closed on
Aug 24, 2006
Sold by
Young Rew A
Bought by
Young Andrew A and Young Nicole Marie
Current Estimated Value
Home Financials for this Owner
Home Financials are based on the most recent Mortgage that was taken out on this home.
Original Mortgage
$240,000
Outstanding Balance
$144,405
Interest Rate
6.8%
Mortgage Type
Stand Alone Refi Refinance Of Original Loan
Estimated Equity
$422,664
Purchase Details
Closed on
Jul 26, 2006
Sold by
Young Rew A
Bought by
Young Andrew A and Young Nicole Marie
Home Financials for this Owner
Home Financials are based on the most recent Mortgage that was taken out on this home.
Original Mortgage
$240,000
Outstanding Balance
$144,405
Interest Rate
6.8%
Mortgage Type
Stand Alone Refi Refinance Of Original Loan
Estimated Equity
$422,664
Purchase Details
Closed on
Jun 27, 2002
Sold by
Young Andrew A
Bought by
Young Andrew A
Purchase Details
Closed on
Sep 9, 1996
Sold by
Tassone Frances Teresa
Bought by
Young Andrew A and Young Sue Ann
Create a Home Valuation Report for This Property
The Home Valuation Report is an in-depth analysis detailing your home's value as well as a comparison with similar homes in the area
Home Values in the Area
Average Home Value in this Area
Purchase History
| Date | Buyer | Sale Price | Title Company |
|---|---|---|---|
| Young Andrew A | -- | -- | |
| Young Andrew A | -- | -- | |
| Young Andrew A | -- | -- | |
| Young Andrew A | $150,000 | -- |
Source: Public Records
Mortgage History
| Date | Status | Borrower | Loan Amount |
|---|---|---|---|
| Open | Young Andrew A | $240,000 | |
| Closed | Young Andrew A | $240,000 | |
| Closed | Young Andrew A | -- |
Source: Public Records
Tax History Compared to Growth
Tax History
| Year | Tax Paid | Tax Assessment Tax Assessment Total Assessment is a certain percentage of the fair market value that is determined by local assessors to be the total taxable value of land and additions on the property. | Land | Improvement |
|---|---|---|---|---|
| 2025 | $3,508 | $331,500 | $0 | $0 |
| 2024 | $3,508 | $316,400 | $141,400 | $175,000 |
| 2023 | $3,403 | $306,767 | $0 | $0 |
| 2022 | $3,298 | $297,133 | $0 | $0 |
| 2021 | $3,315 | $287,500 | $131,400 | $156,100 |
| 2020 | $3,315 | $282,100 | $0 | $0 |
| 2019 | $3,253 | $276,700 | $0 | $0 |
| 2018 | $3,163 | $271,300 | $141,400 | $129,900 |
| 2017 | $3,158 | $271,300 | $0 | $0 |
| 2016 | -- | $270,567 | $0 | $0 |
| 2015 | $3,247 | $270,200 | $0 | $0 |
| 2014 | $3,247 | $270,200 | $0 | $0 |
Source: Public Records
Map
Nearby Homes
- 4235 Norrisville Rd
- 0 Vance Rd
- 4368 Norrisville Rd
- 17741 Troyer Rd
- 0 Troyer Rd
- 17011 Troyer Rd
- 4174 Norrisville Rd
- 17348 Troyer Rd
- 3825 Jarrettsville Pike
- 17414 Wesley Chapel Rd
- 2319 Cool Woods Ct
- 17323 Wesley Chapel Rd
- 4035, 4033 & 4031 Norrisville Rd
- 3620 Woodholme Dr
- 0 Markoe Rd
- 3633 Jarrettsville Pike
- 16131 Old York Rd
- 4031, 4033 & 4035 Norrisville Rd
- 2212 River Bend Ct
- 2016 Wilson Rd
- 4004 Old York Rd
- 4202 Sutton Dr
- 4000 Old York Rd
- 4204 Sutton Dr
- 4206 Sutton Dr
- 4003 Hodges Rd
- 4019 Old York Rd
- 4030 Old York Rd
- 4001 Hodges Rd
- 4029 Old York Rd
- 4203 Sutton Dr
- 4201 Sutton Dr
- 4207 Sutton Dr
- 4205 Sutton Dr
- 4032 Old York Rd
- 4013 Old York Rd
- 3939 Hodges Rd
- 3976 Old York Rd
- 4015 Old York Rd
- 4034 Old York Rd