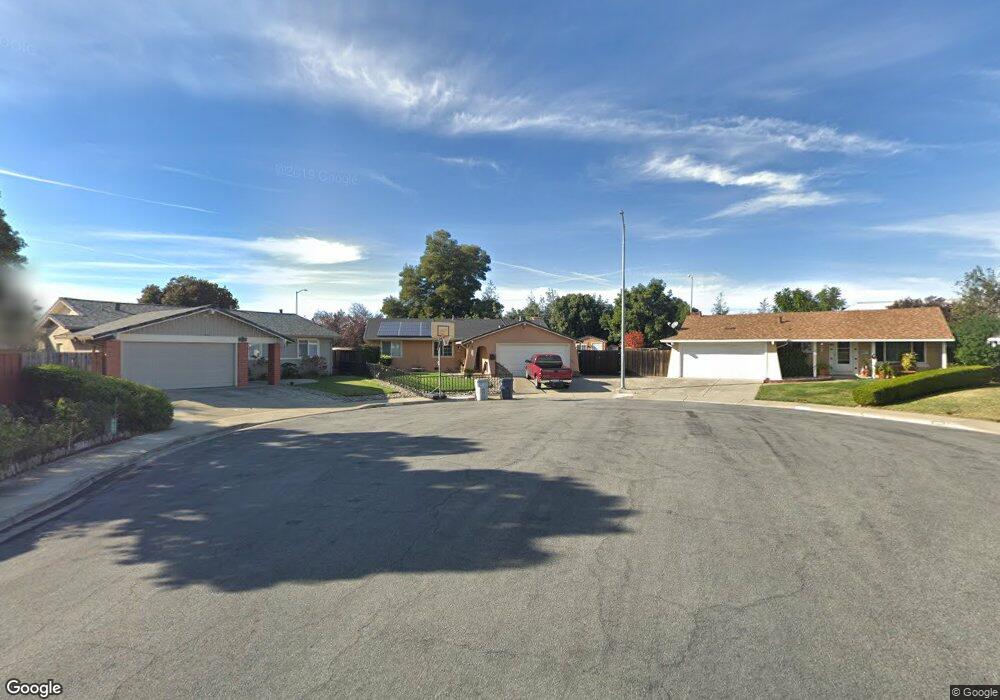
40023 Hutton Ct Fremont, CA 94538
Blacow NeighborhoodEstimated Value: $1,391,000 - $1,514,000
4
Beds
2
Baths
1,436
Sq Ft
$1,023/Sq Ft
Est. Value
About This Home
This home is located at 40023 Hutton Ct, Fremont, CA 94538 and is currently estimated at $1,468,889, approximately $1,022 per square foot. 40023 Hutton Ct is a home located in Alameda County with nearby schools including Steven Millard Elementary, G.M. Walters Middle School, and John F. Kennedy High School.
Ownership History
Date
Name
Owned For
Owner Type
Purchase Details
Closed on
Sep 22, 2016
Sold by
Chambers Christopher M and Chambers Erika A
Bought by
Chambers Christopher M and Chambers Erika A
Current Estimated Value
Home Financials for this Owner
Home Financials are based on the most recent Mortgage that was taken out on this home.
Original Mortgage
$484,500
Outstanding Balance
$388,732
Interest Rate
3.57%
Mortgage Type
New Conventional
Estimated Equity
$1,080,157
Purchase Details
Closed on
Dec 17, 2001
Sold by
Baller Robert and Baller Darlene
Bought by
Chambers Chris M and Chambers Norris E
Home Financials for this Owner
Home Financials are based on the most recent Mortgage that was taken out on this home.
Original Mortgage
$312,000
Interest Rate
6.5%
Purchase Details
Closed on
Oct 3, 1996
Sold by
Herrmann Lee A and Herrmann Betty J
Bought by
Baller Robert and Baller Darlene
Home Financials for this Owner
Home Financials are based on the most recent Mortgage that was taken out on this home.
Original Mortgage
$204,750
Interest Rate
8.1%
Create a Home Valuation Report for This Property
The Home Valuation Report is an in-depth analysis detailing your home's value as well as a comparison with similar homes in the area
Home Values in the Area
Average Home Value in this Area
Purchase History
| Date | Buyer | Sale Price | Title Company |
|---|---|---|---|
| Chambers Christopher M | $242,250 | Advantage Title Llc | |
| Chambers Chris M | $390,000 | North American Title Co | |
| Baller Robert | $227,500 | First American Title Guarant |
Source: Public Records
Mortgage History
| Date | Status | Borrower | Loan Amount |
|---|---|---|---|
| Open | Chambers Christopher M | $484,500 | |
| Previous Owner | Chambers Chris M | $312,000 | |
| Previous Owner | Baller Robert | $204,750 | |
| Closed | Chambers Chris M | $58,500 |
Source: Public Records
Tax History
| Year | Tax Paid | Tax Assessment Tax Assessment Total Assessment is a certain percentage of the fair market value that is determined by local assessors to be the total taxable value of land and additions on the property. | Land | Improvement |
|---|---|---|---|---|
| 2025 | $8,744 | $712,924 | $269,982 | $442,942 |
| 2024 | $8,744 | $698,947 | $264,689 | $434,258 |
| 2023 | $8,507 | $685,245 | $259,500 | $425,745 |
| 2022 | $8,393 | $671,809 | $254,412 | $417,397 |
| 2021 | $8,190 | $658,638 | $249,424 | $409,214 |
| 2020 | $8,197 | $651,888 | $246,868 | $405,020 |
| 2019 | $8,105 | $639,108 | $242,028 | $397,080 |
| 2018 | $7,947 | $626,578 | $237,283 | $389,295 |
| 2017 | $7,750 | $614,294 | $232,631 | $381,663 |
| 2016 | $6,183 | $486,676 | $146,003 | $340,673 |
| 2015 | $6,095 | $479,367 | $143,810 | $335,557 |
| 2014 | $5,986 | $469,980 | $140,994 | $328,986 |
Source: Public Records
Map
Nearby Homes
- 40422 Landon Ave
- 5751 Birch Terrace
- 5560 Cosmos Common Unit 125
- 39676 Bruning St
- 39620 Bliss Ct
- 39605 Bruning St
- 40772 Blacow Rd
- 4531 Stevenson Blvd
- 40242 Crockett St
- 4508 Stevenson Blvd
- 4600 Nelson St
- 4612 Drury Ct
- 4498 Ladner St
- 39861 Pelton Terrace
- 4412 Millard Ave
- 39931 Cedar Blvd Unit 305
- 39997 Cedar Blvd Unit 248
- 5471 Tyler Place
- 39843 Cedar Blvd Unit 227
- 39843 Cedar Blvd Unit 219
- 40049 Hutton Ct
- 40022 Hutton Ct
- 40050 Caffin Ct
- 40048 Hutton Ct
- 5037 Hutton St
- 40024 Caffin Ct
- 5051 Hutton St
- 5025 Hutton St
- 5059 Hutton St
- 5019 Hutton St
- 5042 Hutton St
- 5034 Hutton St
- 5050 Hutton St
- 5075 Hutton St
- 40051 Caffin Ct
- 5026 Hutton St
- 5058 Hutton St
- 5066 Hutton St
- 5083 Hutton St
- 40155 Blacow Rd
Your Personal Tour Guide
Ask me questions while you tour the home.