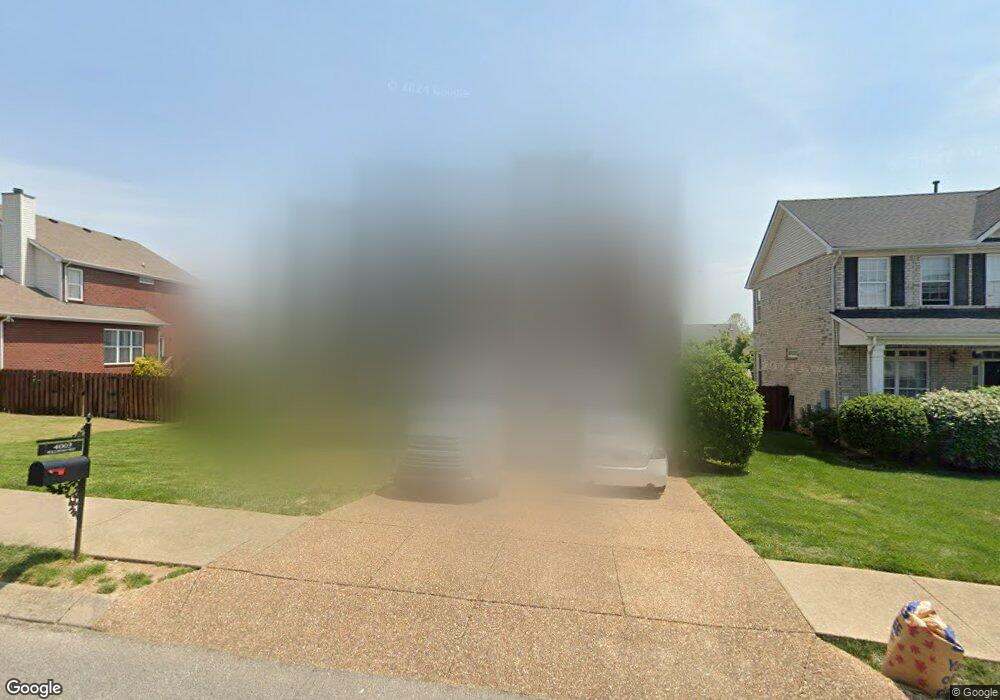
4003 Williford Way Spring Hill, TN 37174
Estimated Value: $644,000 - $678,000
5
Beds
3
Baths
3,028
Sq Ft
$216/Sq Ft
Est. Value
About This Home
This home is located at 4003 Williford Way, Spring Hill, TN 37174 and is currently estimated at $654,658, approximately $216 per square foot. 4003 Williford Way is a home located in Williamson County with nearby schools including Primrose School of Spring Hill and Columbia Academy at Spring Hill.
Ownership History
Date
Name
Owned For
Owner Type
Purchase Details
Closed on
Jul 13, 2023
Sold by
Collier Atarius T and Collier Tameka Rae
Bought by
Collier
Current Estimated Value
Purchase Details
Closed on
Mar 29, 2012
Sold by
Mccarthy George W and Mccarthy Mary L
Bought by
Collier Atarius T and Leslie Collier Tameka
Home Financials for this Owner
Home Financials are based on the most recent Mortgage that was taken out on this home.
Original Mortgage
$246,000
Interest Rate
3.97%
Mortgage Type
FHA
Purchase Details
Closed on
Dec 19, 2006
Sold by
Beazer Homes Corp
Bought by
Mccarthy George W and Mccarthy Mary L
Home Financials for this Owner
Home Financials are based on the most recent Mortgage that was taken out on this home.
Original Mortgage
$219,408
Interest Rate
6.19%
Mortgage Type
Purchase Money Mortgage
Create a Home Valuation Report for This Property
The Home Valuation Report is an in-depth analysis detailing your home's value as well as a comparison with similar homes in the area
Home Values in the Area
Average Home Value in this Area
Purchase History
| Date | Buyer | Sale Price | Title Company |
|---|---|---|---|
| Collier | -- | None Listed On Document | |
| Collier | -- | None Listed On Document | |
| Collier Atarius T | $255,000 | Wagon Wheel Title | |
| Mccarthy George W | $274,260 | None Available |
Source: Public Records
Mortgage History
| Date | Status | Borrower | Loan Amount |
|---|---|---|---|
| Previous Owner | Collier Atarius T | $246,000 | |
| Previous Owner | Mccarthy George W | $219,408 |
Source: Public Records
Tax History Compared to Growth
Tax History
| Year | Tax Paid | Tax Assessment Tax Assessment Total Assessment is a certain percentage of the fair market value that is determined by local assessors to be the total taxable value of land and additions on the property. | Land | Improvement |
|---|---|---|---|---|
| 2025 | $700 | $163,750 | $37,500 | $126,250 |
| 2024 | $700 | $94,775 | $18,750 | $76,025 |
| 2023 | $700 | $94,775 | $18,750 | $76,025 |
| 2022 | $1,734 | $94,775 | $18,750 | $76,025 |
| 2021 | $1,734 | $94,775 | $18,750 | $76,025 |
| 2020 | $1,603 | $74,225 | $11,250 | $62,975 |
| 2019 | $1,603 | $74,225 | $11,250 | $62,975 |
| 2018 | $1,551 | $74,225 | $11,250 | $62,975 |
| 2017 | $1,536 | $74,225 | $11,250 | $62,975 |
| 2016 | $1,514 | $74,225 | $11,250 | $62,975 |
| 2015 | -- | $63,350 | $11,250 | $52,100 |
| 2014 | -- | $63,350 | $11,250 | $52,100 |
Source: Public Records
Map
Nearby Homes
- 1009 Tanyard Springs Dr
- 1047 Tanyard Springs Dr
- 2613 Jake Way
- 2505 Preston Way
- 184 Mary Ann Cir
- 0 Campbell Station Pkwy
- 1071 Mountain View Dr
- 1101 Mountain View Dr
- 1105 Mountain View Dr
- 1103 Mountain View Dr
- 1069 Mountain View Dr Unit 88D
- 1075 Mountain View Dr
- 1079 Mountain View Dr
- 0 O'Hallorn Dr
- 324 Buckwood Ln S
- 469 Buckwood Ave E
- 403 Preakness Dr
- 4750 Columbia Pike
- 2641 Buckner Rd
- 1042 Misty Morn Cir
- 4005 Williford Way
- 1011 Williford Ct
- 1009 Williford Ct
- 1002 Tanyard Springs Dr
- 1004 Tanyard Springs Dr
- 4007 Williford Way
- 1006 Tanyard Springs Dr
- 1007 Williford Ct
- 4000 Williford Way
- 4002 Williford Way
- 4009 Williford Way
- 1008 Tanyard Springs Dr
- 4004 Williford Way
- 1014 Williford Ct
- 1012 Williford Ct
- 1016 Williford Ct
- 1010 Tanyard Springs Dr
- 1010 Williford Ct
- 4011 Williford Way
- 1003 Tanyard Springs Dr