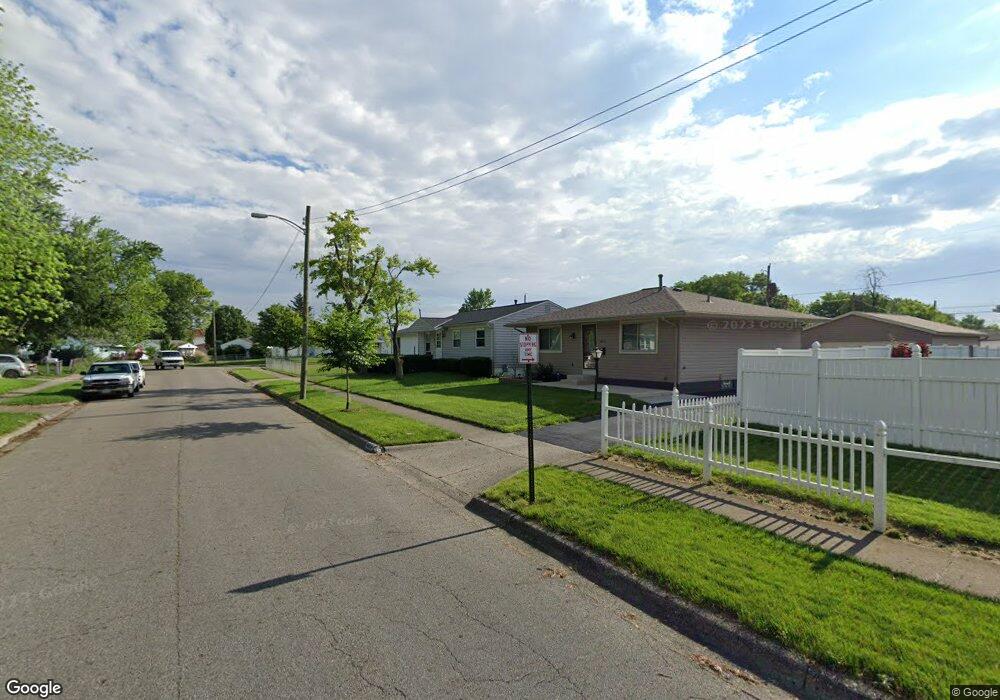
4004 Judson Rd Columbus, OH 43207
Obetz-Lockbourne NeighborhoodEstimated Value: $193,000 - $219,000
3
Beds
1
Bath
936
Sq Ft
$217/Sq Ft
Est. Value
About This Home
This home is located at 4004 Judson Rd, Columbus, OH 43207 and is currently estimated at $203,096, approximately $216 per square foot. 4004 Judson Rd is a home located in Franklin County with nearby schools including Cedarwood Alternative Elementary School @ Stockbri, Buckeye Middle School, and Marion-Franklin High School.
Ownership History
Date
Name
Owned For
Owner Type
Purchase Details
Closed on
Sep 20, 2019
Sold by
Searls Scott and Justice Angela K
Bought by
Searls Jeffrey
Current Estimated Value
Home Financials for this Owner
Home Financials are based on the most recent Mortgage that was taken out on this home.
Original Mortgage
$118,340
Outstanding Balance
$103,657
Interest Rate
3.6%
Mortgage Type
New Conventional
Estimated Equity
$99,439
Purchase Details
Closed on
Aug 2, 1994
Sold by
Myers Ronnie E
Bought by
Justice Scott Searls and Justice Angela K
Home Financials for this Owner
Home Financials are based on the most recent Mortgage that was taken out on this home.
Original Mortgage
$66,462
Interest Rate
8.41%
Mortgage Type
FHA
Purchase Details
Closed on
Jan 12, 1993
Purchase Details
Closed on
Jul 14, 1988
Create a Home Valuation Report for This Property
The Home Valuation Report is an in-depth analysis detailing your home's value as well as a comparison with similar homes in the area
Home Values in the Area
Average Home Value in this Area
Purchase History
| Date | Buyer | Sale Price | Title Company |
|---|---|---|---|
| Searls Jeffrey | $122,000 | Elite Land Title | |
| Justice Scott Searls | $67,900 | -- | |
| -- | -- | -- | |
| -- | -- | -- |
Source: Public Records
Mortgage History
| Date | Status | Borrower | Loan Amount |
|---|---|---|---|
| Open | Searls Jeffrey | $118,340 | |
| Previous Owner | Justice Scott Searls | $66,462 |
Source: Public Records
Tax History Compared to Growth
Tax History
| Year | Tax Paid | Tax Assessment Tax Assessment Total Assessment is a certain percentage of the fair market value that is determined by local assessors to be the total taxable value of land and additions on the property. | Land | Improvement |
|---|---|---|---|---|
| 2024 | $2,375 | $52,930 | $13,480 | $39,450 |
| 2023 | $2,345 | $52,920 | $13,475 | $39,445 |
| 2022 | $1,600 | $30,840 | $8,860 | $21,980 |
| 2021 | $1,602 | $30,840 | $8,860 | $21,980 |
| 2020 | $1,604 | $30,840 | $8,860 | $21,980 |
| 2019 | $1,660 | $27,370 | $7,700 | $19,670 |
| 2018 | $1,457 | $27,370 | $7,700 | $19,670 |
| 2017 | $1,659 | $27,370 | $7,700 | $19,670 |
| 2016 | $1,384 | $20,900 | $4,900 | $16,000 |
| 2015 | $1,257 | $20,900 | $4,900 | $16,000 |
| 2014 | $1,260 | $20,900 | $4,900 | $16,000 |
| 2013 | $732 | $24,605 | $5,775 | $18,830 |
Source: Public Records
Map
Nearby Homes
- 568 Glendora Rd
- 4141 Kershaw Dr
- 4132 Martinsburg Dr
- 4125 Martinsburg Dr
- 812 Breathitt Ave
- 0 Parsons Ave Unit 225012522
- 552 Harland Dr
- 3940 Hillman Rd W
- 312 Harland Dr
- 4309 Salt Spring Ln
- 3714 Parsons Ave
- 4296 Oakwind Dr
- 3735 Christie Rd W
- 3691 Ferman Rd
- 219 Berryville Rd
- 3691 Abney Rd
- 503 Ashwood Rd
- 525 Ashwood Rd
- 0 Jana Kay Ct
- 904 Kyle Ave