
Seller's Agent in 2012
Charlie Armstrong
NAI Ruhl Commercial Company
(563) 529-6600
16 in this area
40 Total Sales
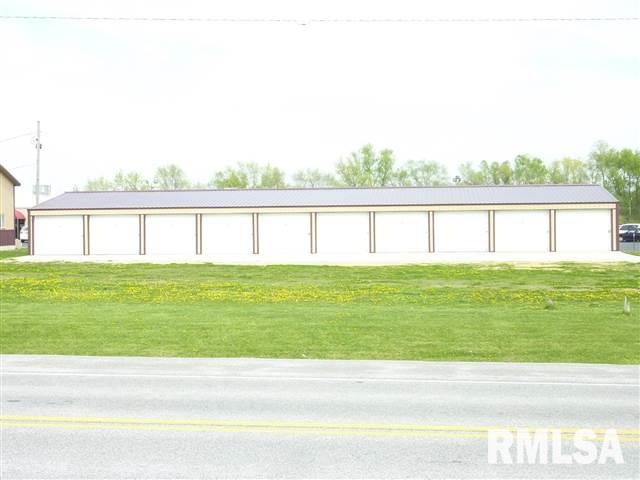
20 unit mini-storage building (4,040 SF). Part of parcel U1723-01A being separated for sale (New Lot #3). Twenty 202 SF storage units rent for $80 mo. = $19,200 GRI per year. Room to expand for an additional 30+ units.
Last Agent to Sell the Property
NAI Ruhl Commercial Company License #S41067000/475.130998 Listed on: 02/21/2012
Last Buyer's Agent
NAI Ruhl Commercial Company License #S41067000/475.130998 Listed on: 02/21/2012
| Date | Event | Price | List to Sale | Price per Sq Ft |
|---|---|---|---|---|
| 11/27/2012 11/27/12 | Sold | $133,000 | -23.0% | -- |
| 09/28/2012 09/28/12 | Pending | -- | -- | -- |
| 02/21/2012 02/21/12 | For Sale | $172,800 | -- | -- |
| Year | Tax Paid | Tax Assessment Tax Assessment Total Assessment is a certain percentage of the fair market value that is determined by local assessors to be the total taxable value of land and additions on the property. | Land | Improvement |
|---|---|---|---|---|
| 2025 | $8,410 | $318,940 | $52,480 | $266,460 |
| 2024 | $8,338 | $318,930 | $52,480 | $266,450 |
| 2023 | $6,222 | $318,930 | $52,480 | $266,450 |
| 2022 | $5,468 | $235,810 | $52,480 | $183,330 |
| 2021 | $5,468 | $235,810 | $52,480 | $183,330 |
| 2020 | $4,162 | $235,810 | $52,480 | $183,330 |
| 2019 | $4,142 | $184,570 | $52,480 | $132,090 |
| 2018 | $5,904 | $184,570 | $52,480 | $132,090 |
| 2017 | $1,661 | $184,570 | $52,480 | $132,090 |
| 2016 | $2,698 | $123,200 | $0 | $0 |
| 2015 | $2,698 | $211,600 | $0 | $0 |
| 2014 | $5,078 | $123,200 | $0 | $0 |
Seller's Agent in 2012
Charlie Armstrong
NAI Ruhl Commercial Company
(563) 529-6600
16 in this area
40 Total Sales
Source: RMLS Alliance
MLS Number: RMAQC7027741
APN: U1723-03B
Disclaimer: Certain information contained herein is derived from information provided by parties other than Homes.com. All information provided is deemed reliable, but is not guaranteed to be accurate and should be independently verified.
![]() IDX information is provided exclusively for personal, non-commercial use, and may not be used for any purpose other than to identify prospective properties consumers may be interested in purchasing. Information is deemed reliable but not guaranteed.
IDX information is provided exclusively for personal, non-commercial use, and may not be used for any purpose other than to identify prospective properties consumers may be interested in purchasing. Information is deemed reliable but not guaranteed.