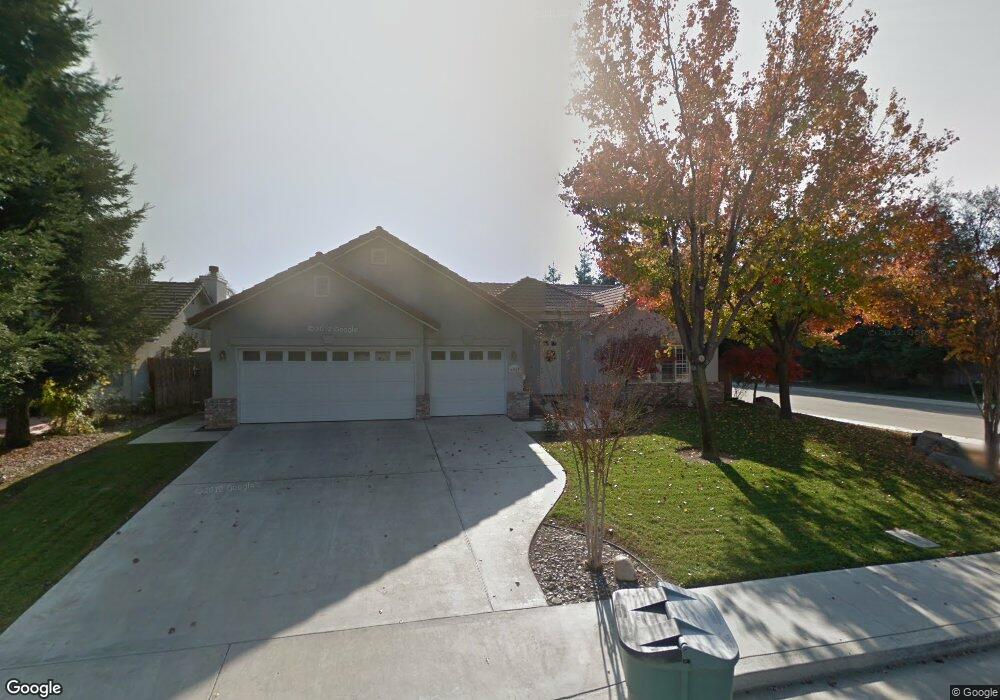
4005 E Stapp Ct Unit 1 Visalia, CA 93292
Northeast Visalia NeighborhoodEstimated Value: $416,000 - $455,000
4
Beds
3
Baths
2,084
Sq Ft
$213/Sq Ft
Est. Value
About This Home
This home is located at 4005 E Stapp Ct Unit 1, Visalia, CA 93292 and is currently estimated at $443,471, approximately $212 per square foot. 4005 E Stapp Ct Unit 1 is a home located in Tulare County with nearby schools including Mineral King Elementary School, Valley Oak Middle School, and Golden West High School.
Ownership History
Date
Name
Owned For
Owner Type
Purchase Details
Closed on
Feb 10, 2015
Sold by
Jiggerian Varsanig Rose
Bought by
Nix Robert J and Nix Kelly L
Current Estimated Value
Home Financials for this Owner
Home Financials are based on the most recent Mortgage that was taken out on this home.
Original Mortgage
$188,000
Outstanding Balance
$142,977
Interest Rate
3.57%
Mortgage Type
New Conventional
Estimated Equity
$300,494
Purchase Details
Closed on
Jun 29, 2009
Sold by
Fletcher Robert Lee
Bought by
Jiggerian Varsanig Rose
Purchase Details
Closed on
Mar 19, 2001
Sold by
Sundowner Homes
Bought by
Fletcher Robert Lee and Fletcher Karan Leann
Home Financials for this Owner
Home Financials are based on the most recent Mortgage that was taken out on this home.
Original Mortgage
$152,455
Interest Rate
6.98%
Create a Home Valuation Report for This Property
The Home Valuation Report is an in-depth analysis detailing your home's value as well as a comparison with similar homes in the area
Home Values in the Area
Average Home Value in this Area
Purchase History
| Date | Buyer | Sale Price | Title Company |
|---|---|---|---|
| Nix Robert J | $235,000 | Chicago Title Co | |
| Jiggerian Varsanig Rose | $175,000 | None Available | |
| Fletcher Robert Lee | $172,500 | Chicago Title Co |
Source: Public Records
Mortgage History
| Date | Status | Borrower | Loan Amount |
|---|---|---|---|
| Open | Nix Robert J | $188,000 | |
| Previous Owner | Fletcher Robert Lee | $152,455 |
Source: Public Records
Tax History
| Year | Tax Paid | Tax Assessment Tax Assessment Total Assessment is a certain percentage of the fair market value that is determined by local assessors to be the total taxable value of land and additions on the property. | Land | Improvement |
|---|---|---|---|---|
| 2025 | $3,130 | $282,431 | $48,072 | $234,359 |
| 2024 | $3,130 | $276,894 | $47,130 | $229,764 |
| 2023 | $3,049 | $271,465 | $46,206 | $225,259 |
| 2022 | $2,921 | $266,143 | $45,300 | $220,843 |
| 2021 | $2,907 | $260,925 | $44,412 | $216,513 |
| 2020 | $2,872 | $258,250 | $43,957 | $214,293 |
| 2019 | $2,776 | $253,186 | $43,095 | $210,091 |
| 2018 | $2,701 | $248,222 | $42,250 | $205,972 |
| 2017 | $2,658 | $243,355 | $41,422 | $201,933 |
| 2016 | $2,618 | $238,584 | $40,610 | $197,974 |
| 2015 | $2,095 | $187,957 | $32,222 | $155,735 |
| 2014 | $2,095 | $184,275 | $31,591 | $152,684 |
Source: Public Records
Map
Nearby Homes
- 3934 E Willow Ave
- 226 N Amador St
- 352 S Wind Ct
- 3632 E Willow Ct
- 4312 E Stapp Ave
- 4122 E Kaweah Ave
- 4132 E Kaweah Ave
- 4331 E Oak Ave
- 3917 E Myrtle Ave
- 3935 E Myrtle Ave
- 4016 E Cypress Ave
- 703 S Grand St
- 3934 E College Ave
- 807 S McAuliff St
- 3148 E Duran Ave
- 804 S Simon St
- 4330 E College Ave
- 825 N Manzanita St
- 3646 E Meadow Ct
- 524 N Velie Ct
- 4005 E Stapp Ct
- 4015 E Stapp Ct Unit 1
- 4015 E Stapp Ct
- 4000 E Acequia Ave
- 4010 E Acequia Ave
- 4025 E Stapp Ct
- 3933 E Stapp Ct
- 4004 E Stapp Ct
- 3930 E Acequia Ave
- 4014 E Stapp Ct
- 4022 E Acequia Ave Unit 1
- 4022 E Acequia Ave
- 4031 E Stapp Ct
- 3932 E Stapp Ct
- 3917 E Stapp Ct
- 4028 E Stapp Ct
- 3920 E Acequia Ave
- 4032 E Acequia Ave
- 4003 E Center Ave
- 3918 E Stapp Ct
Your Personal Tour Guide
Ask me questions while you tour the home.