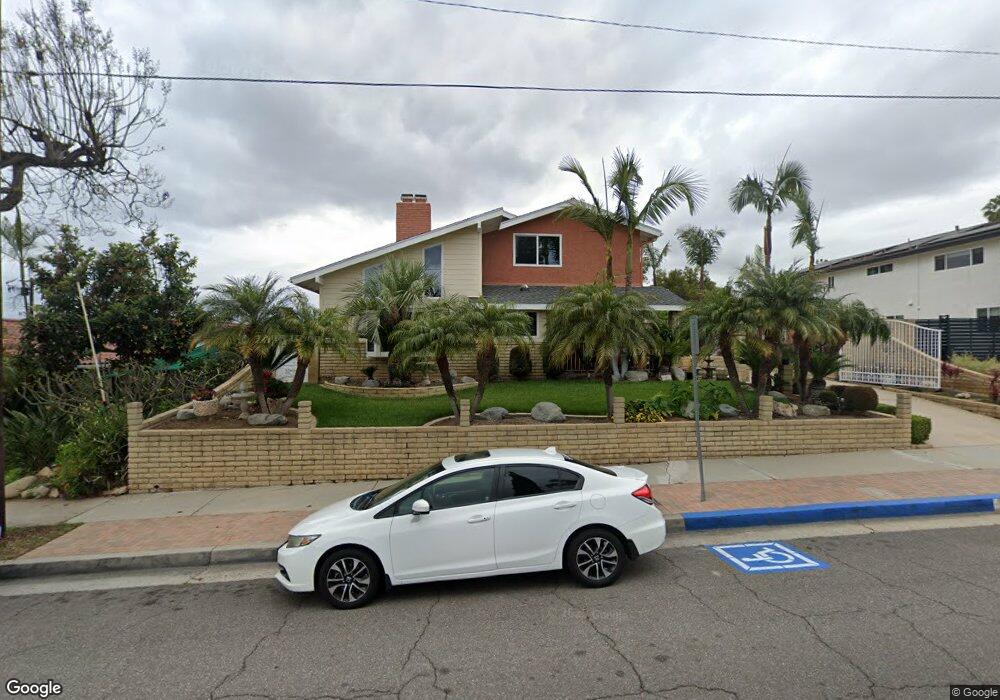
4007 E Palmyra Ave Orange, CA 92869
Estimated Value: $1,181,000 - $2,183,000
4
Beds
3
Baths
2,580
Sq Ft
$582/Sq Ft
Est. Value
About This Home
This home is located at 4007 E Palmyra Ave, Orange, CA 92869 and is currently estimated at $1,502,531, approximately $582 per square foot. 4007 E Palmyra Ave is a home located in Orange County with nearby schools including Jordan Academy of Language & Computer Science, El Modena High School, and Orange County Classical Academy.
Ownership History
Date
Name
Owned For
Owner Type
Purchase Details
Closed on
Feb 1, 2021
Sold by
Sanchez Graciella M and Sanchez Michael S
Bought by
Sanchez Graciella M and Sanchez Michael S
Current Estimated Value
Purchase Details
Closed on
Dec 18, 2019
Sold by
Sanchez Joe A and Sanchez Graciella M
Bought by
Sanchez Joe A and Sanchez Graciella M
Purchase Details
Closed on
May 9, 2007
Sold by
Sanchez Joe A and Sanchez Graciella M
Bought by
Sanchez Joe A and Sanchez Graciella M
Home Financials for this Owner
Home Financials are based on the most recent Mortgage that was taken out on this home.
Original Mortgage
$220,000
Interest Rate
6.12%
Mortgage Type
New Conventional
Purchase Details
Closed on
Feb 20, 2002
Sold by
Sanchez Joe Angel and Sanchez Graciella M
Bought by
Sanchez Joe A and Sanchez Graciella M
Create a Home Valuation Report for This Property
The Home Valuation Report is an in-depth analysis detailing your home's value as well as a comparison with similar homes in the area
Home Values in the Area
Average Home Value in this Area
Purchase History
| Date | Buyer | Sale Price | Title Company |
|---|---|---|---|
| Sanchez Graciella M | -- | None Available | |
| Sanchez Joe A | -- | None Available | |
| Sanchez Joe A | -- | Chicago Title Co | |
| Sanchez Joe A | -- | -- |
Source: Public Records
Mortgage History
| Date | Status | Borrower | Loan Amount |
|---|---|---|---|
| Closed | Sanchez Joe A | $220,000 |
Source: Public Records
Tax History
| Year | Tax Paid | Tax Assessment Tax Assessment Total Assessment is a certain percentage of the fair market value that is determined by local assessors to be the total taxable value of land and additions on the property. | Land | Improvement |
|---|---|---|---|---|
| 2025 | $2,797 | $239,126 | $44,474 | $194,652 |
| 2024 | $2,797 | $234,438 | $43,602 | $190,836 |
| 2023 | $2,731 | $229,842 | $42,747 | $187,095 |
| 2022 | $2,674 | $225,336 | $41,909 | $183,427 |
| 2021 | $2,602 | $220,918 | $41,087 | $179,831 |
| 2020 | $2,576 | $218,653 | $40,665 | $177,988 |
| 2019 | $2,545 | $214,366 | $39,867 | $174,499 |
| 2018 | $2,506 | $210,163 | $39,085 | $171,078 |
| 2017 | $2,407 | $206,043 | $38,319 | $167,724 |
| 2016 | $2,361 | $202,003 | $37,567 | $164,436 |
| 2015 | $2,325 | $198,969 | $37,002 | $161,967 |
| 2014 | $2,274 | $195,072 | $36,277 | $158,795 |
Source: Public Records
Map
Nearby Homes
- 338 S James St
- 4223 E Marmon Ave
- 4700 E Washington Ave
- 466 S Wellington Rd
- 4008 E Fernwood Ave
- 244 S Violet Ln
- 12281 Baja Panorama
- 4900 E Chapman Ave Unit 51
- 4346 E Casselle Ave
- 3801 E Spring St
- 19002 E Smiley Dr
- 18831 Winnwood Ln
- 3139 E Chapman Ave Unit 3B
- 12574 Vista Panorama
- 3030 E Elgin Place
- 18945 Fowler Ave
- 3406 E Lochleven Ln Unit B
- 12348 Circula Panorama
- 448 N Londonderry Ln Unit D
- 19031 E Center Ave
- 3947 E Palmyra Ave
- 4015 E Palmyra Ave
- 4031 E Palmyra Ave
- 310 S Heatherstone St
- 4002 E Palmyra Ave
- 3929 E Palmyra Ave
- 3942 E Alanda Ave
- 3940 E Palmyra Ave
- 298 S Esplanade St
- 3928 E Alanda Ave
- 320 S Heatherstone St
- 3915 E Palmyra Ave
- 311 S Heatherstone St
- 3943 E Alanda Ave
- 3920 E Palmyra Ave
- 4007 E Donna Ave
- 3914 E Alanda Ave
- 330 S Heatherstone St
- 319 S Heatherstone St
- 3943 E Donna Ave
Your Personal Tour Guide
Ask me questions while you tour the home.