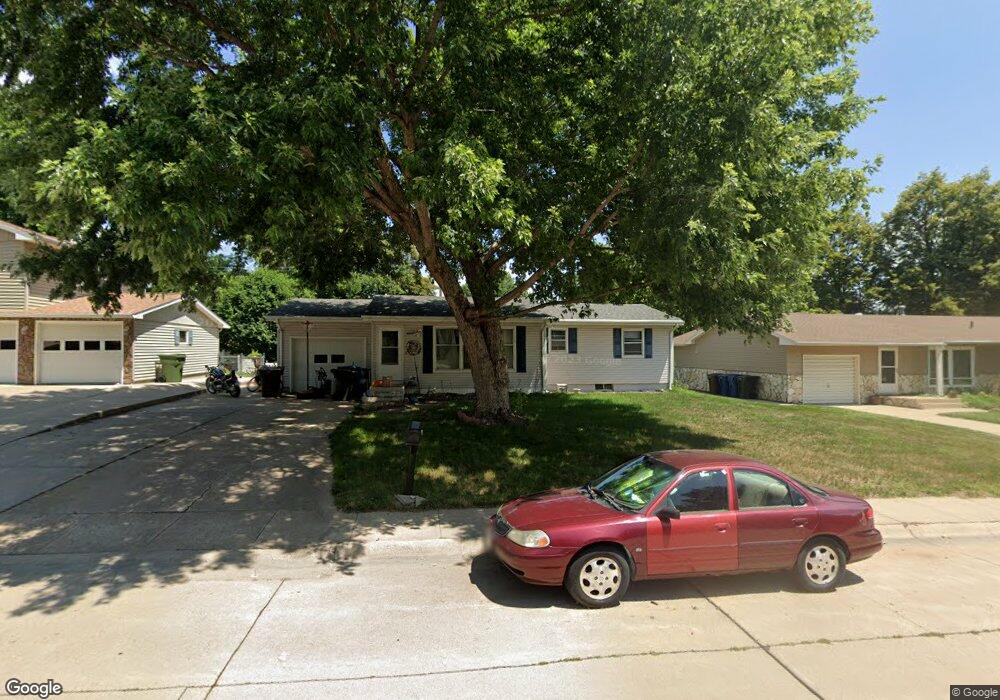
4007 Indian Rd Kearney, NE 68847
Estimated Value: $247,000 - $278,000
4
Beds
2
Baths
1,096
Sq Ft
$239/Sq Ft
Est. Value
About This Home
This home is located at 4007 Indian Rd, Kearney, NE 68847 and is currently estimated at $262,341, approximately $239 per square foot. 4007 Indian Rd is a home located in Buffalo County with nearby schools including Northeast Elementary School, Sunrise Middle School, and Kearney Senior High School.
Ownership History
Date
Name
Owned For
Owner Type
Purchase Details
Closed on
Jun 29, 2021
Sold by
Bab Properties Llc
Bought by
Babutzke Jamie L
Current Estimated Value
Home Financials for this Owner
Home Financials are based on the most recent Mortgage that was taken out on this home.
Original Mortgage
$209,000
Outstanding Balance
$189,635
Interest Rate
2.9%
Mortgage Type
New Conventional
Estimated Equity
$72,706
Purchase Details
Closed on
Jun 22, 2016
Sold by
Jochum Harold T and Jochum Leann L
Bought by
Bab Properties Llc
Purchase Details
Closed on
Dec 31, 2014
Sold by
Kring Margaret A
Bought by
Clausen Leann L
Home Financials for this Owner
Home Financials are based on the most recent Mortgage that was taken out on this home.
Original Mortgage
$123,120
Interest Rate
3.93%
Mortgage Type
Purchase Money Mortgage
Purchase Details
Closed on
Jun 5, 2014
Sold by
Rhonda J Rhonda J
Bought by
Kring Margaret A
Create a Home Valuation Report for This Property
The Home Valuation Report is an in-depth analysis detailing your home's value as well as a comparison with similar homes in the area
Home Values in the Area
Average Home Value in this Area
Purchase History
| Date | Buyer | Sale Price | Title Company |
|---|---|---|---|
| Babutzke Jamie L | $220,000 | Ne Title | |
| Bab Properties Llc | $172,000 | Central Nebraska Title | |
| Clausen Leann L | $153,900 | Barney Abstract And Title | |
| Kring Margaret A | $153,900 | Barney |
Source: Public Records
Mortgage History
| Date | Status | Borrower | Loan Amount |
|---|---|---|---|
| Open | Babutzke Jamie L | $209,000 | |
| Previous Owner | Clausen Leann L | $123,120 |
Source: Public Records
Tax History Compared to Growth
Tax History
| Year | Tax Paid | Tax Assessment Tax Assessment Total Assessment is a certain percentage of the fair market value that is determined by local assessors to be the total taxable value of land and additions on the property. | Land | Improvement |
|---|---|---|---|---|
| 2025 | $2,682 | $210,975 | $44,515 | $166,460 |
| 2024 | $2,682 | $202,395 | $43,215 | $159,180 |
| 2023 | $3,223 | $189,350 | $43,215 | $146,135 |
| 2022 | $2,961 | $168,745 | $43,190 | $125,555 |
| 2021 | $2,747 | $159,285 | $41,260 | $118,025 |
| 2020 | $2,729 | $157,760 | $39,735 | $118,025 |
| 2019 | $2,728 | $155,785 | $39,560 | $116,225 |
| 2018 | $2,597 | $150,475 | $33,580 | $116,895 |
| 2017 | $2,637 | $153,765 | $33,580 | $120,185 |
| 2016 | $2,615 | $153,765 | $33,580 | $120,185 |
| 2015 | $2,376 | $136,605 | $0 | $0 |
| 2014 | $2,239 | $117,425 | $0 | $0 |
Source: Public Records
Map
Nearby Homes