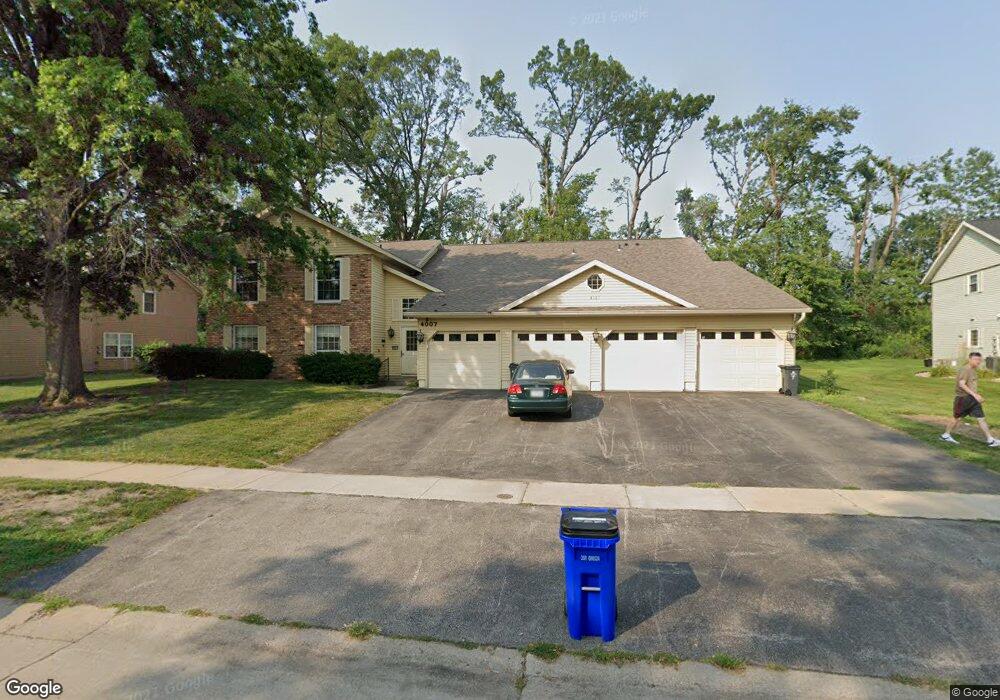
4007 Lexington Dr NE Unit A Cedar Rapids, IA 52402
Estimated Value: $141,000 - $148,511
3
Beds
2
Baths
1,316
Sq Ft
$110/Sq Ft
Est. Value
About This Home
This home is located at 4007 Lexington Dr NE Unit A, Cedar Rapids, IA 52402 and is currently estimated at $144,128, approximately $109 per square foot. 4007 Lexington Dr NE Unit A is a home located in Linn County with nearby schools including Ponderosa Elementary School, Pierce Elementary School, and Franklin Middle School.
Ownership History
Date
Name
Owned For
Owner Type
Purchase Details
Closed on
May 16, 2011
Sold by
Wenndt Merry Yedlik and Wenndt Dennis
Bought by
Jackson Marcia L
Current Estimated Value
Home Financials for this Owner
Home Financials are based on the most recent Mortgage that was taken out on this home.
Original Mortgage
$80,000
Outstanding Balance
$55,596
Interest Rate
4.88%
Mortgage Type
Future Advance Clause Open End Mortgage
Estimated Equity
$88,532
Purchase Details
Closed on
Feb 28, 2003
Sold by
Samek Leo F and Samek Leona M
Bought by
Wenndt Merry Yedlik
Home Financials for this Owner
Home Financials are based on the most recent Mortgage that was taken out on this home.
Original Mortgage
$74,000
Interest Rate
6%
Purchase Details
Closed on
May 13, 1998
Sold by
Arons Terry L and Goranson Terry L
Bought by
Samek Leo F and Samek Leona M
Create a Home Valuation Report for This Property
The Home Valuation Report is an in-depth analysis detailing your home's value as well as a comparison with similar homes in the area
Home Values in the Area
Average Home Value in this Area
Purchase History
| Date | Buyer | Sale Price | Title Company |
|---|---|---|---|
| Jackson Marcia L | $79,500 | None Available | |
| Wenndt Merry Yedlik | $92,000 | -- | |
| Samek Leo F | $87,500 | -- |
Source: Public Records
Mortgage History
| Date | Status | Borrower | Loan Amount |
|---|---|---|---|
| Open | Jackson Marcia L | $80,000 | |
| Previous Owner | Wenndt Merry Yedlik | $74,000 |
Source: Public Records
Tax History Compared to Growth
Tax History
| Year | Tax Paid | Tax Assessment Tax Assessment Total Assessment is a certain percentage of the fair market value that is determined by local assessors to be the total taxable value of land and additions on the property. | Land | Improvement |
|---|---|---|---|---|
| 2025 | $2,296 | $149,700 | $19,000 | $130,700 |
| 2024 | $2,376 | $141,400 | $19,000 | $122,400 |
| 2023 | $2,376 | $140,200 | $19,000 | $121,200 |
| 2022 | $2,330 | $121,500 | $16,000 | $105,500 |
| 2021 | $2,428 | $121,400 | $16,000 | $105,400 |
| 2020 | $2,428 | $118,600 | $16,000 | $102,600 |
| 2019 | $2,230 | $112,000 | $16,000 | $96,000 |
| 2018 | $2,148 | $112,000 | $16,000 | $96,000 |
| 2017 | $2,166 | $108,000 | $8,000 | $100,000 |
| 2016 | $2,209 | $103,900 | $8,000 | $95,900 |
| 2015 | $2,235 | $105,035 | $8,000 | $97,035 |
| 2014 | $2,050 | $105,035 | $8,000 | $97,035 |
| 2013 | $2,002 | $105,035 | $8,000 | $97,035 |
Source: Public Records
Map
Nearby Homes
- 3915 Lexington Dr NE Unit B
- 4113 Lexington Ct NE Unit C
- 4113 Lexington Ct NE Unit A
- 3608 Foxborough Terrace NE Unit B
- 3607 Foxborough Terrace NE Unit A
- 4131 Blue Jay Dr NE Unit A
- 4131 Blue Jay Dr NE Unit C
- 3524 Swallow Ct NE
- 4010 Red Cedar Dr NE Unit B
- 4113 Lark Ct NE Unit 4113
- 5230 Edgewood Rd NE
- 4417 Twin Pine Dr NE
- 3920 Wyndham Dr NE
- 4433 Coventry Ln NE
- 3719 Blue Mound Dr NE
- 2817 Old Orchard Rd NE
- 4104 Treeline Ct NE Unit 4104
- 3604 Heatheridge Dr NE
- 4545 Westchester Dr NE Unit D
- 4645 Westchester Dr NE Unit A
- 4007 Lexington Dr NE
- 4007 Lexington Dr NE
- 4007 Lexington Dr NE Unit D
- 4007 Lexington Dr NE Unit C
- 3921 Lexington Dr NE
- 3921 Lexington Dr NE
- 3921 Lexington Dr NE
- 3921 Lexington Dr NE Unit D
- 3921 Lexington Dr NE Unit B
- 3921 Lexington Dr NE Unit A
- 4013 Lexington Dr NE Unit C
- 4013 Lexington Dr NE
- 4013 Lexington Dr NE
- 4013 Lexington Dr NE
- 4013 Lexington Dr NE Unit D
- 4013 Lexington Dr NE Unit A
- 4002 Lexington Dr NE
- 4002 Lexington Dr NE
- 4002 Lexington Dr NE
- 4002 Lexington Dr NE