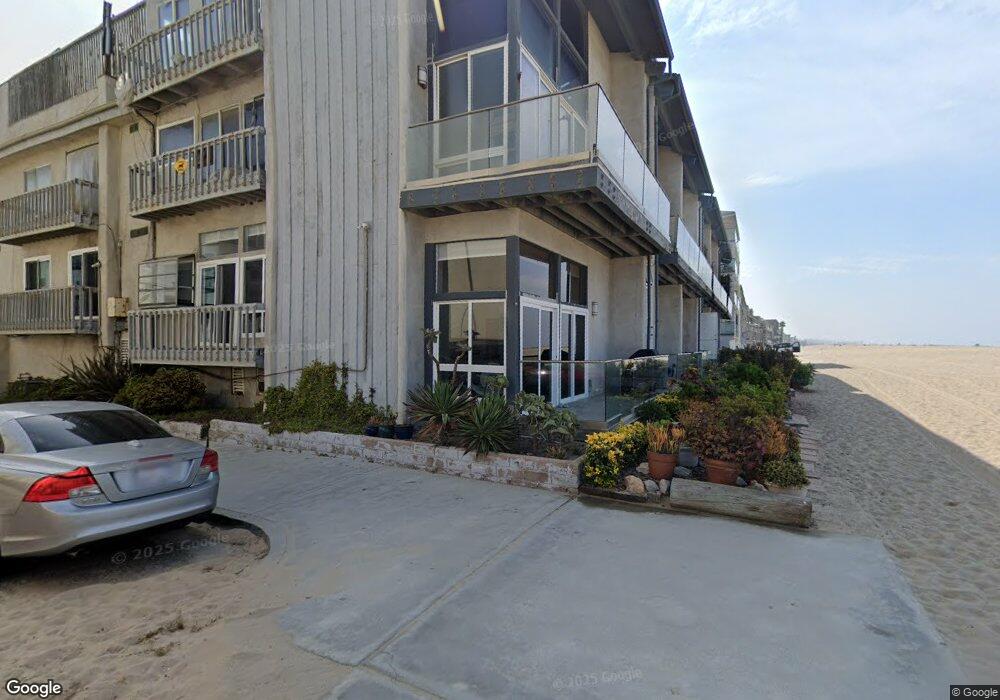
4007 Ocean Front Walk Unit 3 Marina Del Rey, CA 90292
Estimated Value: $2,577,000 - $3,191,000
2
Beds
3
Baths
1,654
Sq Ft
$1,687/Sq Ft
Est. Value
About This Home
This home is located at 4007 Ocean Front Walk Unit 3, Marina Del Rey, CA 90292 and is currently estimated at $2,790,915, approximately $1,687 per square foot. 4007 Ocean Front Walk Unit 3 is a home located in Los Angeles County with nearby schools including Coeur D'Alene Avenue Elementary School, Marina Del Rey Middle School, and Venice High School.
Ownership History
Date
Name
Owned For
Owner Type
Purchase Details
Closed on
Mar 11, 2008
Sold by
Ebrahimian Shawn
Bought by
Wood Park Llc
Current Estimated Value
Purchase Details
Closed on
Mar 13, 2006
Sold by
Halpin Selter Lynda
Bought by
Ebrahimian Shawn
Home Financials for this Owner
Home Financials are based on the most recent Mortgage that was taken out on this home.
Original Mortgage
$1,225,000
Interest Rate
7%
Mortgage Type
Negative Amortization
Purchase Details
Closed on
Apr 10, 2000
Sold by
Williams Roberta
Bought by
Halpin Selter Lynda
Home Financials for this Owner
Home Financials are based on the most recent Mortgage that was taken out on this home.
Original Mortgage
$332,500
Interest Rate
7.75%
Purchase Details
Closed on
Nov 12, 1993
Sold by
Herman Arthur
Bought by
Williams Roberta
Home Financials for this Owner
Home Financials are based on the most recent Mortgage that was taken out on this home.
Original Mortgage
$350,000
Interest Rate
6.88%
Create a Home Valuation Report for This Property
The Home Valuation Report is an in-depth analysis detailing your home's value as well as a comparison with similar homes in the area
Home Values in the Area
Average Home Value in this Area
Purchase History
| Date | Buyer | Sale Price | Title Company |
|---|---|---|---|
| Wood Park Llc | -- | Fatcola | |
| Ebrahimian Shawn | -- | Alliance Title Company | |
| Halpin Selter Lynda | $665,000 | Benefit Land Title Ins Co | |
| Williams Roberta | $480,000 | -- |
Source: Public Records
Mortgage History
| Date | Status | Borrower | Loan Amount |
|---|---|---|---|
| Previous Owner | Ebrahimian Shawn | $1,225,000 | |
| Previous Owner | Halpin Selter Lynda | $332,500 | |
| Previous Owner | Williams Roberta | $350,000 |
Source: Public Records
Tax History Compared to Growth
Tax History
| Year | Tax Paid | Tax Assessment Tax Assessment Total Assessment is a certain percentage of the fair market value that is determined by local assessors to be the total taxable value of land and additions on the property. | Land | Improvement |
|---|---|---|---|---|
| 2025 | $32,332 | $2,733,140 | $568,276 | $2,164,864 |
| 2024 | $32,332 | $2,679,550 | $557,134 | $2,122,416 |
| 2023 | $31,697 | $2,627,010 | $546,210 | $2,080,800 |
| 2022 | $30,206 | $2,575,500 | $535,500 | $2,040,000 |
| 2021 | $25,200 | $2,129,664 | $1,820,231 | $309,433 |
| 2020 | $25,467 | $2,107,828 | $1,801,567 | $306,261 |
| 2019 | $24,437 | $2,066,499 | $1,766,243 | $300,256 |
| 2018 | $24,379 | $2,025,980 | $1,731,611 | $294,369 |
| 2016 | $23,332 | $1,947,311 | $1,664,371 | $282,940 |
| 2015 | $20,320 | $1,694,400 | $1,448,000 | $246,400 |
| 2014 | $20,783 | $1,542,400 | $1,318,100 | $224,300 |
Source: Public Records
Map
Nearby Homes
- 1 Jib St Unit 103
- 20 Ironsides St Unit 8
- 3817 Ocean Front Walk
- 3806 Ocean Front Walk
- 3812 Pacific Ave Unit 2
- 32 Galleon St
- 3711 Ocean Front Walk Unit 3
- 128 Roma Ct
- 131 Galleon St Unit 2
- 14 Mast St
- 4300 Via Dolce Unit 102
- 4200 Via Dolce Unit 230
- 4350 Via Dolce Unit 311
- 4250 Via Dolce Unit 321
- 14 Northstar St
- 120 Mast Mall
- 6 Northstar St Unit 304
- 3516 Via Dolce
- 120 Northstar Mall
- 3501 Esplanade
- 4003 Ocean Front Walk Unit 5
- 4003 1/2 Ocean Front Walk Unit 1/2
- 4003 Ocean Front Walk Unit 1/2
- 4005 Ocean Front Walk Unit 1/2
- 4007 Ocean Front Walk Unit 1/2
- 4009 Ocean Front Walk Unit 1/2
- 4003 Ocean Front Walk
- 4005 Ocean Front Walk
- 4003 1/2 Ocean Front Walk
- 4001 Ocean Front Walk
- 4007 Ocean Front Walk
- 4009 Ocean Front Walk
- 4011 1/2 Ocean Front Walk Unit 1/2
- 4011 Ocean Front Walk Unit 1
- 4011 Ocean Front Walk
- 4001 1/2 Ocean Front Walk
- 4005 1/2 Ocean Front Walk
- 4007 1/2 Ocean Front Walk Unit 9
- 4009 1/2 Ocean Front Walk
- 4011 1/2 Ocean Front Walk