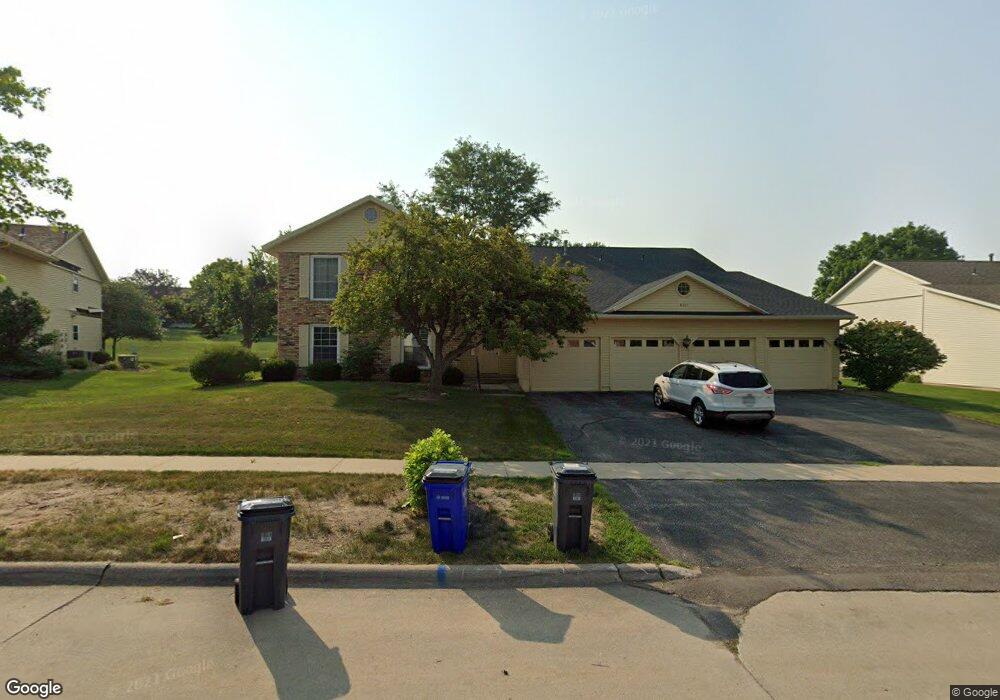
4007 Summerfield Ln NE Cedar Rapids, IA 52402
Estimated Value: $129,000 - $142,000
2
Beds
2
Baths
1,147
Sq Ft
$118/Sq Ft
Est. Value
About This Home
This home is located at 4007 Summerfield Ln NE, Cedar Rapids, IA 52402 and is currently estimated at $135,490, approximately $118 per square foot. 4007 Summerfield Ln NE is a home located in Linn County with nearby schools including Ponderosa Elementary School, Pierce Elementary School, and Franklin Middle School.
Ownership History
Date
Name
Owned For
Owner Type
Purchase Details
Closed on
Aug 10, 2020
Sold by
King Rachel J
Bought by
Kruckenberg Mindy M
Current Estimated Value
Home Financials for this Owner
Home Financials are based on the most recent Mortgage that was taken out on this home.
Original Mortgage
$98,955
Outstanding Balance
$88,574
Interest Rate
3.5%
Mortgage Type
New Conventional
Estimated Equity
$46,916
Purchase Details
Closed on
Jul 3, 2017
Sold by
Larson Ray T and Cleveland Carolyn M
Bought by
King Rachel J
Home Financials for this Owner
Home Financials are based on the most recent Mortgage that was taken out on this home.
Original Mortgage
$71,200
Interest Rate
4%
Mortgage Type
Adjustable Rate Mortgage/ARM
Purchase Details
Closed on
Oct 4, 2011
Sold by
Mckinney Linda S and Nationwide Advantage Mortgage
Bought by
Larson Ray T
Create a Home Valuation Report for This Property
The Home Valuation Report is an in-depth analysis detailing your home's value as well as a comparison with similar homes in the area
Home Values in the Area
Average Home Value in this Area
Purchase History
| Date | Buyer | Sale Price | Title Company |
|---|---|---|---|
| Kruckenberg Mindy M | $110,000 | None Available | |
| King Rachel J | $89,000 | None Available | |
| Larson Ray T | $59,275 | None Available |
Source: Public Records
Mortgage History
| Date | Status | Borrower | Loan Amount |
|---|---|---|---|
| Open | Kruckenberg Mindy M | $98,955 | |
| Previous Owner | King Rachel J | $71,200 |
Source: Public Records
Tax History Compared to Growth
Tax History
| Year | Tax Paid | Tax Assessment Tax Assessment Total Assessment is a certain percentage of the fair market value that is determined by local assessors to be the total taxable value of land and additions on the property. | Land | Improvement |
|---|---|---|---|---|
| 2025 | $2,068 | $128,300 | $19,000 | $109,300 |
| 2024 | $2,014 | $128,500 | $19,000 | $109,500 |
| 2023 | $2,014 | $127,300 | $19,000 | $108,300 |
| 2022 | $1,978 | $104,400 | $16,000 | $88,400 |
| 2021 | $2,166 | $104,400 | $16,000 | $88,400 |
| 2020 | $2,166 | $106,800 | $16,000 | $90,800 |
| 2019 | $1,896 | $96,500 | $16,000 | $80,500 |
| 2018 | $1,964 | $96,500 | $16,000 | $80,500 |
| 2017 | $2,008 | $92,200 | $7,000 | $85,200 |
| 2016 | $1,886 | $88,700 | $7,000 | $81,700 |
| 2015 | $1,904 | $89,521 | $7,000 | $82,521 |
| 2014 | $1,904 | $89,521 | $7,000 | $82,521 |
| 2013 | -- | $89,521 | $7,000 | $82,521 |
Source: Public Records
Map
Nearby Homes
- 3608 Foxborough Terrace NE Unit B
- 3607 Foxborough Terrace NE Unit A
- 3524 Swallow Ct NE
- 4113 Lexington Ct NE Unit C
- 4113 Lexington Ct NE Unit A
- 4131 Blue Jay Dr NE Unit A
- 4131 Blue Jay Dr NE Unit C
- 3915 Lexington Dr NE Unit B
- 4113 Lark Ct NE Unit 4113
- 4010 Red Cedar Dr NE Unit B
- 4417 Twin Pine Dr NE
- 3920 Wyndham Dr NE
- 4433 Coventry Ln NE
- 5230 Edgewood Rd NE
- 3604 Heatheridge Dr NE
- 4545 Westchester Dr NE Unit D
- 2817 Old Orchard Rd NE
- 2611 Brookland Dr NE
- 3719 Blue Mound Dr NE
- 4460 Westchester Dr NE Unit C
- 4007 Summerfield Ln NE Unit A
- 4007 Summerfield Ln NE Unit B
- 4007 Summerfield Ln NE Unit D
- 4007 Summerfield Ln NE
- 4007 Summerfield Ln NE Unit C
- 3919 Summerfield Ln NE
- 3919 Summerfield Ln NE
- 3919 Summerfield Ln NE Unit D
- 3919 Summerfield Ln NE Unit A
- 4019 Summerfield Ln NE Unit C
- 4019 Summerfield Ln NE Unit B
- 4019 Summerfield Ln NE
- 4019 Summerfield Ln NE
- 4019 Summerfield Ln NE Unit A
- 4008 Summerfield Ln NE
- 4008 Summerfield Ln NE Unit B
- 4008 Summerfield Ln NE
- 4008 Summerfield Ln NE Unit D
- 4008 Summerfield Ln NE Unit C
- 3912 Summerfield Ln NE