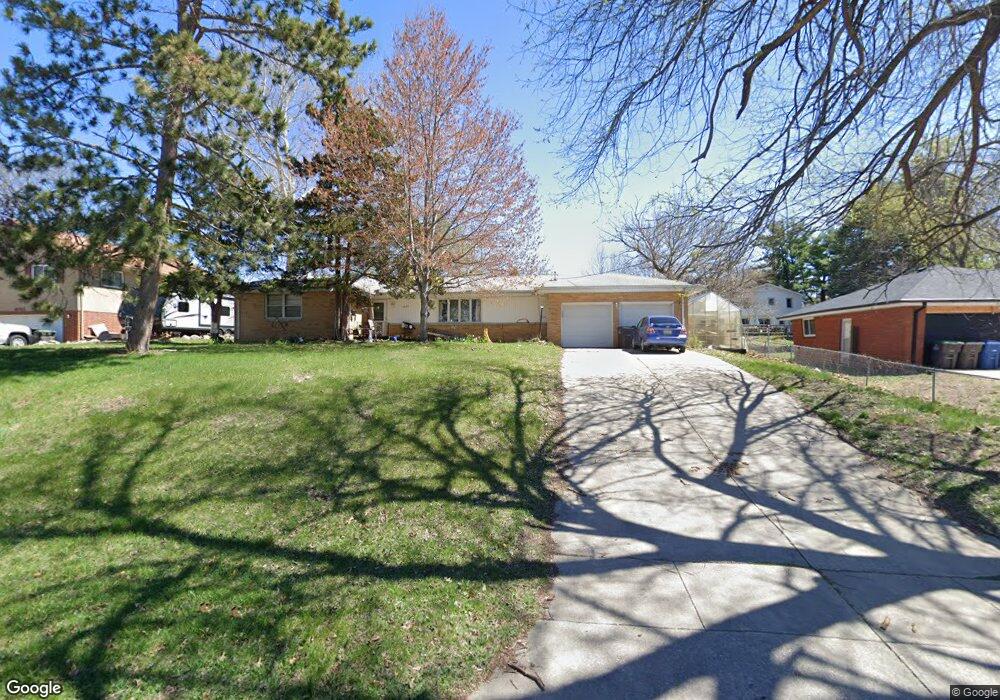
4007 SW 31st St Des Moines, IA 50321
Southwestern Hills NeighborhoodEstimated Value: $236,281 - $291,000
3
Beds
1
Bath
1,337
Sq Ft
$200/Sq Ft
Est. Value
About This Home
This home is located at 4007 SW 31st St, Des Moines, IA 50321 and is currently estimated at $267,820, approximately $200 per square foot. 4007 SW 31st St is a home located in Polk County with nearby schools including Jefferson Elementary School, Brody Middle School, and Lincoln High School.
Ownership History
Date
Name
Owned For
Owner Type
Purchase Details
Closed on
Sep 1, 2016
Sold by
Miller Linda F
Bought by
Renaud Scott A and Renaud Jessica L
Current Estimated Value
Purchase Details
Closed on
Jun 27, 2011
Sold by
Linda F Miller Revocable Living Trust
Bought by
Renaud Jessica L and Renaud Scott A
Home Financials for this Owner
Home Financials are based on the most recent Mortgage that was taken out on this home.
Original Mortgage
$120,000
Interest Rate
4.67%
Mortgage Type
Seller Take Back
Purchase Details
Closed on
Feb 9, 2011
Sold by
Woolsey Eric J and Woolsey Martha G
Bought by
Woolsey Eric J and Woolsey Martha G
Purchase Details
Closed on
Jan 20, 2011
Sold by
Estey Barbara Joan and Woolsey Eric J
Bought by
Woolsey Eric J
Purchase Details
Closed on
Jul 23, 2009
Sold by
Estate Of Kenneth D Wahl
Bought by
John Judy Kay
Purchase Details
Closed on
Dec 18, 2008
Sold by
Miller Linda F
Bought by
Miller Linda F and Linda F Miller Revocable Living Trust
Create a Home Valuation Report for This Property
The Home Valuation Report is an in-depth analysis detailing your home's value as well as a comparison with similar homes in the area
Home Values in the Area
Average Home Value in this Area
Purchase History
| Date | Buyer | Sale Price | Title Company |
|---|---|---|---|
| Renaud Scott A | -- | None Available | |
| Renaud Jessica L | $150,000 | None Available | |
| Woolsey Eric J | -- | None Available | |
| Woolsey Eric J | -- | None Available | |
| John Judy Kay | -- | None Available | |
| Miller Linda F | -- | None Available |
Source: Public Records
Mortgage History
| Date | Status | Borrower | Loan Amount |
|---|---|---|---|
| Previous Owner | Renaud Jessica L | $120,000 |
Source: Public Records
Tax History Compared to Growth
Tax History
| Year | Tax Paid | Tax Assessment Tax Assessment Total Assessment is a certain percentage of the fair market value that is determined by local assessors to be the total taxable value of land and additions on the property. | Land | Improvement |
|---|---|---|---|---|
| 2025 | $3,302 | $197,700 | $54,200 | $143,500 |
| 2024 | $3,302 | $185,300 | $49,900 | $135,400 |
| 2023 | $3,170 | $185,300 | $49,900 | $135,400 |
| 2022 | $3,144 | $143,400 | $39,900 | $103,500 |
| 2021 | $3,332 | $143,400 | $39,900 | $103,500 |
| 2020 | $3,456 | $142,100 | $39,400 | $102,700 |
| 2019 | $3,052 | $142,100 | $39,400 | $102,700 |
| 2018 | $3,016 | $122,100 | $33,900 | $88,200 |
| 2017 | $2,828 | $122,100 | $33,900 | $88,200 |
| 2016 | $2,750 | $113,100 | $31,000 | $82,100 |
| 2015 | $2,750 | $113,100 | $31,000 | $82,100 |
| 2014 | $3,058 | $115,100 | $30,900 | $84,200 |
Source: Public Records
Map
Nearby Homes
- 3921 SW 29th St
- 3110 Stanton Ave
- 4401 SW 29th St
- 3619 SW 34th St
- 3618 SW 34th St
- 3700 SW 34th Place
- 3407 SW 31st St
- 3500 SW 28th St
- 2900 Caulder Ave
- 3706 SW 36th St
- 3200 Park Ave
- 5815 Rose Cir
- 5821 Rose Cir
- 5817 Rose Cir
- 5822 Rose Cir
- 5813 Rose Cir
- 2614 Caulder Ave
- 4400 SW 23rd St
- 4420 SW 23rd St
- 2401 Emma Ave
- 4001 SW 31st St
- 4015 SW 31st St
- 4000 SW 30th St
- 4023 SW 31st St
- 2917 Watrous Ave
- 4006 SW 30th St
- 4006 SW 31st St
- 4002 SW 31st St
- 4008 SW 31st St
- 3920 SW 31st St
- 4010 SW 31st St
- 3007 Summit Vista Dr
- 2911 Watrous Ave
- 3017 Summit Vista Dr
- 3001 Summit Vista Dr
- 3001 Summit Vista Dr
- 3910 SW 31st St
- 4003 SW 30th St
- 4020 SW 31st St
- 4007 SW 32nd St