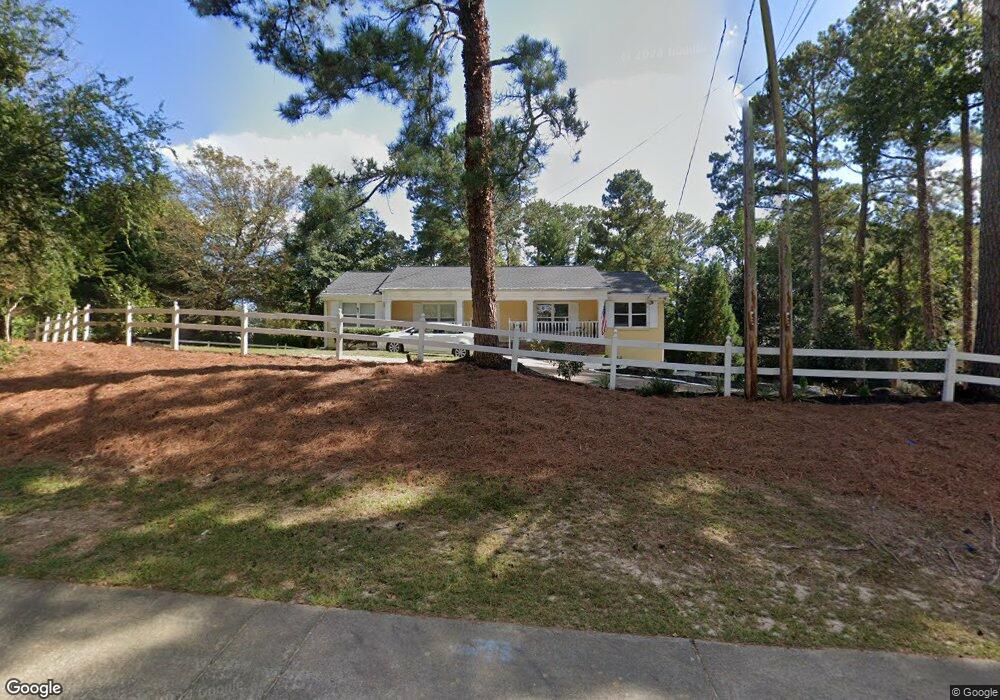
4008 Lower Roswell Rd Marietta, GA 30068
Estimated Value: $530,000 - $628,000
3
Beds
2
Baths
1,637
Sq Ft
$340/Sq Ft
Est. Value
About This Home
This home is located at 4008 Lower Roswell Rd, Marietta, GA 30068 and is currently estimated at $556,667, approximately $340 per square foot. 4008 Lower Roswell Rd is a home located in Cobb County with nearby schools including East Side Elementary School, Dickerson Middle School, and Walton High School.
Ownership History
Date
Name
Owned For
Owner Type
Purchase Details
Closed on
May 7, 2012
Sold by
Salazar Marina M
Bought by
Salazarmejia Maria M
Current Estimated Value
Purchase Details
Closed on
Jul 15, 2004
Sold by
Janeira Nellie
Bought by
Salazar Marina M
Home Financials for this Owner
Home Financials are based on the most recent Mortgage that was taken out on this home.
Original Mortgage
$154,000
Interest Rate
6.25%
Mortgage Type
New Conventional
Purchase Details
Closed on
Nov 7, 2000
Sold by
Hyde David G
Bought by
Janeira Nellie
Home Financials for this Owner
Home Financials are based on the most recent Mortgage that was taken out on this home.
Original Mortgage
$139,500
Interest Rate
7.83%
Mortgage Type
New Conventional
Create a Home Valuation Report for This Property
The Home Valuation Report is an in-depth analysis detailing your home's value as well as a comparison with similar homes in the area
Home Values in the Area
Average Home Value in this Area
Purchase History
| Date | Buyer | Sale Price | Title Company |
|---|---|---|---|
| Salazarmejia Maria M | -- | -- | |
| Salazar Marina M | $194,000 | -- | |
| Janeira Nellie | $155,000 | -- |
Source: Public Records
Mortgage History
| Date | Status | Borrower | Loan Amount |
|---|---|---|---|
| Previous Owner | Salazar Marina M | $154,000 | |
| Previous Owner | Janeira Nellie | $139,500 |
Source: Public Records
Tax History Compared to Growth
Tax History
| Year | Tax Paid | Tax Assessment Tax Assessment Total Assessment is a certain percentage of the fair market value that is determined by local assessors to be the total taxable value of land and additions on the property. | Land | Improvement |
|---|---|---|---|---|
| 2024 | $936 | $158,736 | $90,476 | $68,260 |
| 2023 | $676 | $140,640 | $72,380 | $68,260 |
| 2022 | $865 | $135,072 | $66,812 | $68,260 |
| 2021 | $835 | $125,080 | $66,812 | $58,268 |
| 2020 | $802 | $113,944 | $55,676 | $58,268 |
| 2019 | $802 | $113,944 | $55,676 | $58,268 |
| 2018 | $777 | $105,664 | $51,504 | $54,160 |
| 2017 | $695 | $105,664 | $51,504 | $54,160 |
| 2016 | $674 | $97,312 | $43,152 | $54,160 |
| 2015 | $683 | $87,012 | $32,852 | $54,160 |
| 2014 | $668 | $79,304 | $0 | $0 |
Source: Public Records
Map
Nearby Homes
- 411 Woodstone Dr W
- 3825 Creekview Dr NE
- 3785 Lower Roswell Rd
- 50 Old Fuller Mill Rd NE
- 181 Sentinel Place SE
- 575 Indian Hills Pkwy
- 4300 Cove Island Dr NE
- 4283 Blackland Dr
- 3661 Clubwood Trail
- 350 Ridgewater Dr
- 3830 Valley Green Dr
- 590 Clubwood Ct
- 4201 Fairgreen Terrace NE
- 59 Woodlawn Dr NE
- 141 Indian Hills Ct
- 3 Woodlawn Dr NE
- 500 Ridgewater Dr
- 120 Woodlawn Dr NE
- 4116 River Cliff Chase SE
- 4006 Lower Roswell Rd
- 295 Dickerson Rd NE
- 4010 Lower Roswell Rd
- 303 Woodstone Dr
- 4004 Lower Roswell Rd
- 4004 Lower Roswell Rd Unit 2
- 4025 Lower Roswell Rd
- 269 Dickerson Rd NE
- 306 Greyhaven Ln
- 290 Dickerson Rd NE
- 300 Woodstone Dr
- 320 Dickerson Rd NE
- 4000 Lower Roswell Rd
- 313 Woodstone Dr
- 316 Greyhaven Ln
- 3944 Lakeshore Way NE
- 326 Greyhaven Ln
- 275 Dickerson Rd NE
- 310 Woodstone Dr
- 297 Greyhaven Ln