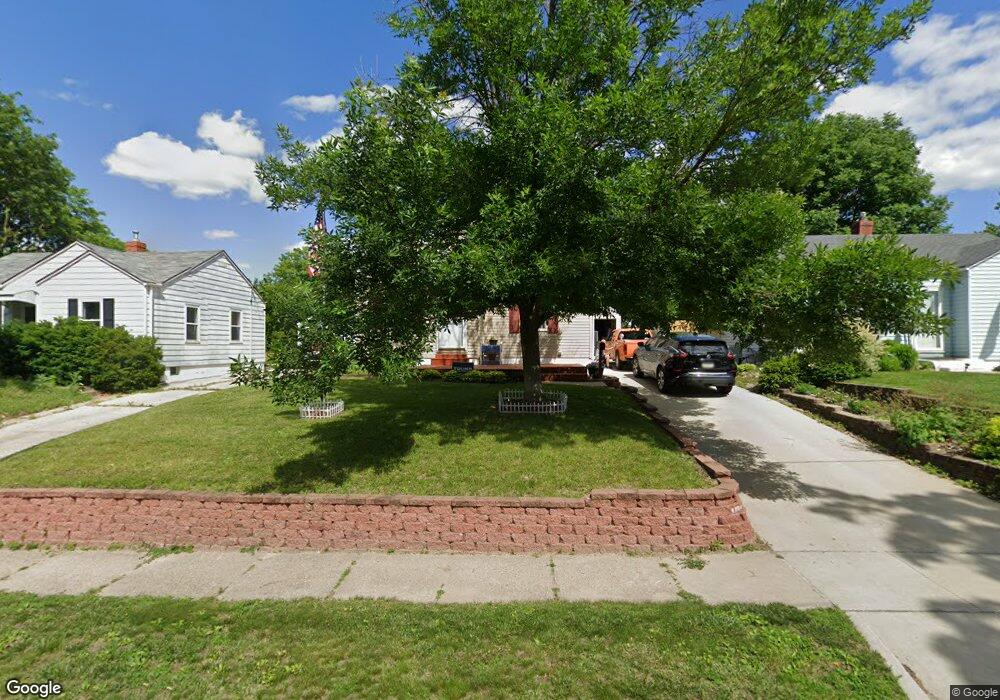
4009 1st St Des Moines, IA 50313
Highland Park NeighborhoodEstimated Value: $149,347 - $178,000
2
Beds
2
Baths
706
Sq Ft
$227/Sq Ft
Est. Value
About This Home
This home is located at 4009 1st St, Des Moines, IA 50313 and is currently estimated at $160,587, approximately $227 per square foot. 4009 1st St is a home located in Polk County with nearby schools including Madison Elementary School, Harding Middle School, and North High School.
Ownership History
Date
Name
Owned For
Owner Type
Purchase Details
Closed on
Jan 22, 2009
Sold by
Frost Sean Thomas and Frost Michelle
Bought by
Grant Rebecca R
Current Estimated Value
Home Financials for this Owner
Home Financials are based on the most recent Mortgage that was taken out on this home.
Original Mortgage
$85,373
Outstanding Balance
$54,708
Interest Rate
5.44%
Mortgage Type
FHA
Estimated Equity
$105,879
Purchase Details
Closed on
Feb 18, 1999
Sold by
Backer David R and Backer Rita H
Bought by
Frost Sean Thomas
Home Financials for this Owner
Home Financials are based on the most recent Mortgage that was taken out on this home.
Original Mortgage
$55,765
Interest Rate
6.88%
Purchase Details
Closed on
Dec 13, 1997
Sold by
Backer Frank T and Backer Carol
Bought by
Backer David R and Backer Rita H
Create a Home Valuation Report for This Property
The Home Valuation Report is an in-depth analysis detailing your home's value as well as a comparison with similar homes in the area
Home Values in the Area
Average Home Value in this Area
Purchase History
| Date | Buyer | Sale Price | Title Company |
|---|---|---|---|
| Grant Rebecca R | $86,000 | None Available | |
| Frost Sean Thomas | $58,500 | -- | |
| Backer David R | -- | -- |
Source: Public Records
Mortgage History
| Date | Status | Borrower | Loan Amount |
|---|---|---|---|
| Open | Grant Rebecca R | $85,373 | |
| Previous Owner | Frost Sean Thomas | $55,765 |
Source: Public Records
Tax History
| Year | Tax Paid | Tax Assessment Tax Assessment Total Assessment is a certain percentage of the fair market value that is determined by local assessors to be the total taxable value of land and additions on the property. | Land | Improvement |
|---|---|---|---|---|
| 2025 | $2,374 | $149,000 | $31,500 | $117,500 |
| 2024 | $2,374 | $131,100 | $27,300 | $103,800 |
| 2023 | $2,398 | $131,100 | $27,300 | $103,800 |
| 2022 | $2,378 | $110,600 | $23,800 | $86,800 |
| 2021 | $2,206 | $110,600 | $23,800 | $86,800 |
| 2020 | $2,286 | $97,000 | $20,700 | $76,300 |
| 2019 | $2,068 | $97,000 | $20,700 | $76,300 |
| 2018 | $2,042 | $85,500 | $18,000 | $67,500 |
| 2017 | $1,900 | $85,500 | $18,000 | $67,500 |
| 2016 | $1,846 | $78,800 | $16,200 | $62,600 |
| 2015 | $1,846 | $78,800 | $16,200 | $62,600 |
| 2014 | $1,934 | $81,500 | $16,400 | $65,100 |
Source: Public Records
Map
Nearby Homes
Your Personal Tour Guide
Ask me questions while you tour the home.