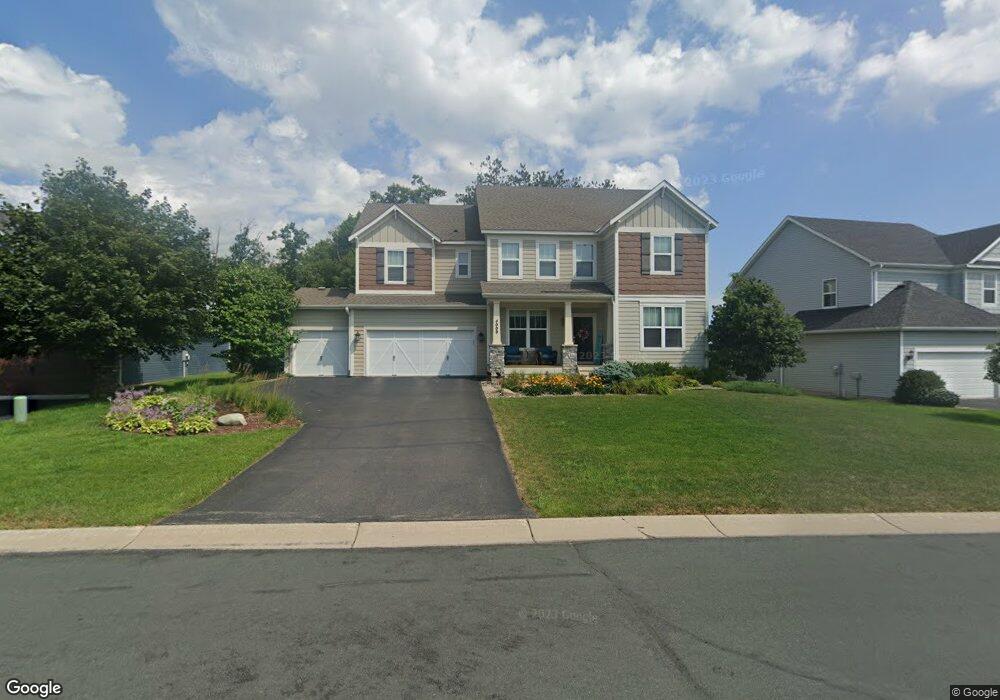
4009 87th St E Inver Grove Heights, MN 55076
Estimated Value: $684,000 - $750,000
5
Beds
4
Baths
3,102
Sq Ft
$234/Sq Ft
Est. Value
About This Home
This home is located at 4009 87th St E, Inver Grove Heights, MN 55076 and is currently estimated at $725,008, approximately $233 per square foot. 4009 87th St E is a home located in Dakota County with nearby schools including Pine Bend Elementary School, Inver Grove Heights Middle School, and Simley Senior High School.
Ownership History
Date
Name
Owned For
Owner Type
Purchase Details
Closed on
Jun 22, 2018
Sold by
Michal Jonathan and Jones Daniel
Bought by
Faust Anthony and Faust Jennifer
Current Estimated Value
Home Financials for this Owner
Home Financials are based on the most recent Mortgage that was taken out on this home.
Original Mortgage
$485,910
Outstanding Balance
$420,231
Interest Rate
4.5%
Mortgage Type
New Conventional
Estimated Equity
$304,777
Purchase Details
Closed on
Sep 28, 2015
Sold by
Pulte Homes Of Minnesota Llc
Bought by
Michal Jonathan
Home Financials for this Owner
Home Financials are based on the most recent Mortgage that was taken out on this home.
Original Mortgage
$417,000
Interest Rate
3.91%
Mortgage Type
New Conventional
Purchase Details
Closed on
Sep 21, 2011
Sold by
Igh Development Llc
Bought by
Wells Fargo Bank National Association
Create a Home Valuation Report for This Property
The Home Valuation Report is an in-depth analysis detailing your home's value as well as a comparison with similar homes in the area
Home Values in the Area
Average Home Value in this Area
Purchase History
| Date | Buyer | Sale Price | Title Company |
|---|---|---|---|
| Faust Anthony | $539,900 | Watermark Title Agency | |
| Michal Jonathan | $440,000 | Pgp Title Inc | |
| Wells Fargo Bank National Association | -- | None Available |
Source: Public Records
Mortgage History
| Date | Status | Borrower | Loan Amount |
|---|---|---|---|
| Open | Faust Anthony | $485,910 | |
| Previous Owner | Michal Jonathan | $417,000 |
Source: Public Records
Tax History
| Year | Tax Paid | Tax Assessment Tax Assessment Total Assessment is a certain percentage of the fair market value that is determined by local assessors to be the total taxable value of land and additions on the property. | Land | Improvement |
|---|---|---|---|---|
| 2024 | $7,196 | $702,400 | $175,200 | $527,200 |
| 2023 | $7,196 | $660,800 | $170,700 | $490,100 |
| 2022 | $7,168 | $672,800 | $175,500 | $497,300 |
| 2021 | $6,666 | $616,800 | $152,600 | $464,200 |
| 2020 | $6,224 | $571,500 | $145,300 | $426,200 |
| 2019 | $6,096 | $537,600 | $138,400 | $399,200 |
| 2018 | $7,622 | $497,400 | $131,800 | $365,600 |
| 2017 | $6,492 | $531,400 | $174,300 | $357,100 |
| 2016 | $6,772 | $509,700 | $166,100 | $343,600 |
| 2015 | $6,848 | $528,400 | $162,000 | $366,400 |
| 2014 | -- | $511,100 | $156,000 | $355,100 |
| 2013 | -- | $361,900 | $145,500 | $216,400 |
Source: Public Records
Map
Nearby Homes
- 8686 Cole Ct
- 8590 Corcoran Path
- 8487 Corcoran Path Unit 61
- 8456 Copperfield Way
- 8404 Copperfield Way Unit 101
- 3853 90th St E
- 8015 Cooper Ave
- 7886 Dempsey Way
- 8694 Callahan Trail
- 8755 Benson Way Unit 101
- 8752 Bechtel Ave Unit 95
- 3907 Conroy Trail
- 3901 Conroy Trail
- 8489 Bryce Ct
- 8615 Beverly Way Unit 27
- 3857 Conroy Trail
- 3617 76th Ln E
- 7614 Connie Ln
- 8746 Baxter Way Unit 35
- 2768 87th St E Unit 13
- 4009 4009 87th-Street-e
- 3999 87th St E
- 4033 87th St E
- 4033 4033 87th-Street-e
- 8554 Crismon Way
- 3967 3967 87th St E
- 3967 87th St E
- 8664 Cole Ct
- 3974 87th St E
- 8562 Crismon Way
- 4067 87th St E
- 4067 4067 87th-Street-e
- 3945 87th St E
- 4008 87th St E
- 8672 Cole Ct
- 3962 87th St E
- 4026 87th St E
- 8572 Crismon Way
- 4083 87th St E
- 3923 87th St E
Your Personal Tour Guide
Ask me questions while you tour the home.