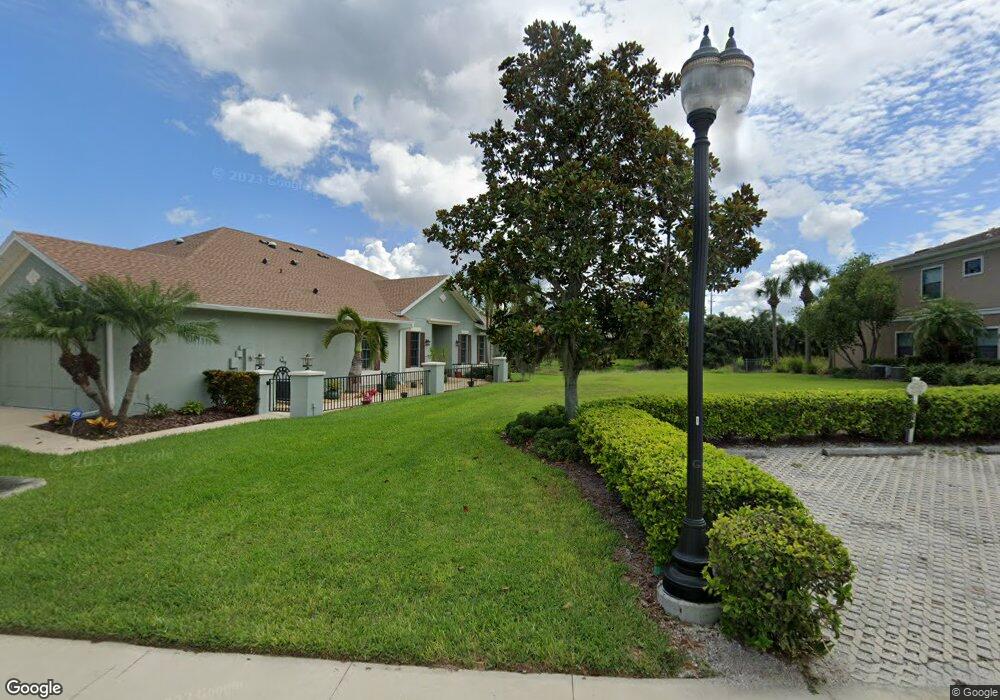
4009 Overture Cir Unit 311 Bradenton, FL 34209
West Bradenton NeighborhoodEstimated Value: $343,118 - $372,000
3
Beds
3
Baths
1,627
Sq Ft
$218/Sq Ft
Est. Value
About This Home
This home is located at 4009 Overture Cir Unit 311, Bradenton, FL 34209 and is currently estimated at $354,780, approximately $218 per square foot. 4009 Overture Cir Unit 311 is a home located in Manatee County with nearby schools including Sea Breeze Elementary School, W. D. Sugg Middle School, and Bayshore High School.
Ownership History
Date
Name
Owned For
Owner Type
Purchase Details
Closed on
Dec 6, 2024
Sold by
Fox Brenda D
Bought by
Karrer Ross and Karrer Lisa
Current Estimated Value
Home Financials for this Owner
Home Financials are based on the most recent Mortgage that was taken out on this home.
Original Mortgage
$250,000
Outstanding Balance
$248,007
Interest Rate
6.72%
Mortgage Type
New Conventional
Estimated Equity
$106,773
Purchase Details
Closed on
Aug 28, 2021
Sold by
Fox Gregory and Fox Brenda D
Bought by
Fox Brenda D
Purchase Details
Closed on
Jan 31, 2008
Sold by
Taylor Morrison Of Florida Inc
Bought by
Fox Gregory and Fox Brenda D
Home Financials for this Owner
Home Financials are based on the most recent Mortgage that was taken out on this home.
Original Mortgage
$80,000
Interest Rate
6.17%
Mortgage Type
Purchase Money Mortgage
Create a Home Valuation Report for This Property
The Home Valuation Report is an in-depth analysis detailing your home's value as well as a comparison with similar homes in the area
Home Values in the Area
Average Home Value in this Area
Purchase History
| Date | Buyer | Sale Price | Title Company |
|---|---|---|---|
| Karrer Ross | $370,000 | None Listed On Document | |
| Fox Brenda D | -- | None Available | |
| Fox Gregory | $170,500 | Attorney |
Source: Public Records
Mortgage History
| Date | Status | Borrower | Loan Amount |
|---|---|---|---|
| Open | Karrer Ross | $250,000 | |
| Previous Owner | Fox Gregory | $80,000 |
Source: Public Records
Tax History Compared to Growth
Tax History
| Year | Tax Paid | Tax Assessment Tax Assessment Total Assessment is a certain percentage of the fair market value that is determined by local assessors to be the total taxable value of land and additions on the property. | Land | Improvement |
|---|---|---|---|---|
| 2025 | $7,343 | $284,750 | -- | $284,750 |
| 2024 | $7,343 | $331,500 | -- | $331,500 |
| 2023 | $6,371 | $314,500 | $0 | $314,500 |
| 2022 | $4,981 | $252,000 | $0 | $252,000 |
| 2021 | $4,251 | $186,000 | $0 | $186,000 |
| 2020 | $4,134 | $170,000 | $0 | $170,000 |
| 2019 | $3,984 | $161,000 | $0 | $161,000 |
| 2018 | $3,917 | $156,000 | $0 | $0 |
| 2017 | $3,798 | $157,350 | $0 | $0 |
| 2016 | $3,670 | $157,350 | $0 | $0 |
| 2015 | $3,446 | $140,500 | $0 | $0 |
| 2014 | $3,446 | $124,479 | $0 | $0 |
| 2013 | $3,196 | $105,849 | $1 | $105,848 |
Source: Public Records
Map
Nearby Homes
- 4063 Overture Cir Unit 4063
- 4067 Overture Cir Unit 340
- 4026 Overture Cir Unit 487
- 7325 Skybird Rd Unit 399
- 4046 Overture Cir Unit 4046
- 4204 Overture Cir Unit 4204
- 4235 Overture Cir Unit 444
- 4158 Overture Cir
- 7206 Hamilton Rd
- 7317 Emma Rd
- 7321 Emma Rd
- 7344 Skybird Rd
- 4139 Overture Cir Unit 374
- 3901 71st St W
- 3901 71st St W Unit 170
- 3901 71st St W Unit 209
- 3901 71st St W Unit 129
- 3901 71st St W Unit 100
- 3901 71st St W Unit 98
- 3901 71st St W Unit 191
- 4178 Overture Cir Unit 521
- 4132 Overture Cir Unit 538
- 4059 Overture Cir Unit 336
- 4149 Overture Cir Unit 379
- 4155 Overture Cir Unit 382
- 7325 Skybird Rd Unit 7325
- 4085 Overture Cir Unit 4085
- 4085 Overture Cir Unit 349
- 4118 Overture Cir Unit 4118
- 4118 Overture Cir Unit 531
- 4126 Overture Cir Unit 535
- 4125 Overture Cir Unit 4125
- 7331 Skybird Rd Unit 402
- 4174 Overture Cir Unit 519
- 4179 Overture Cir Unit 4179
- 4180 Overture Cir Unit 4180
- 4122 Overture Cir Unit 533
- 4121 Overture Cir Unit 363
- 7319 Skybird Rd Unit 7913
- 4029 Overture Cir Unit 4029