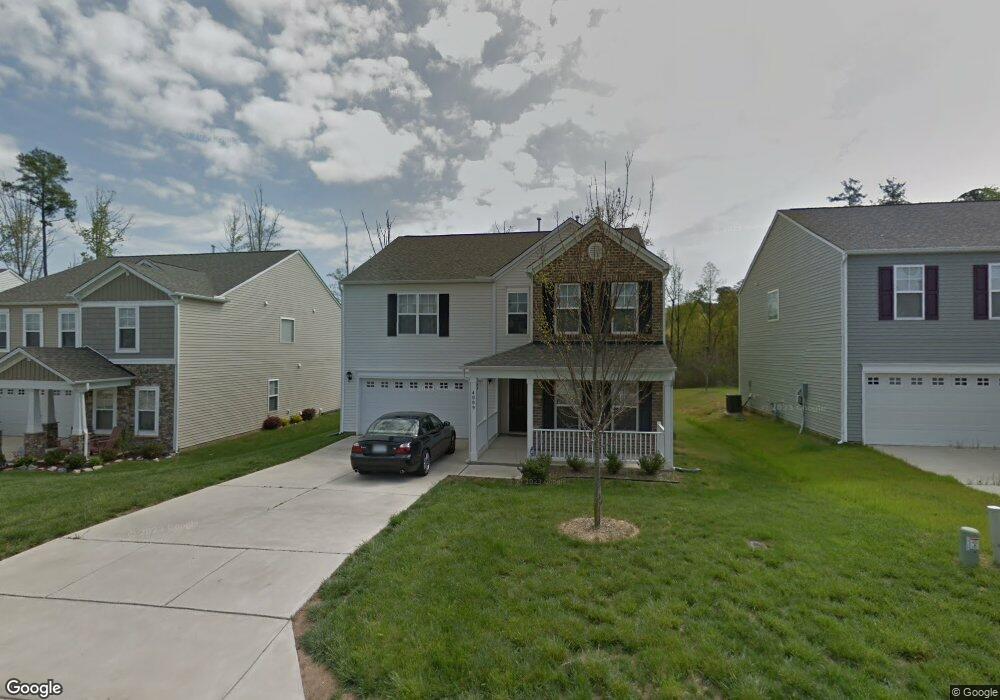
4009 Twin Spires Dr Knightdale, NC 27545
Estimated Value: $416,000 - $430,000
4
Beds
3
Baths
2,755
Sq Ft
$153/Sq Ft
Est. Value
About This Home
This home is located at 4009 Twin Spires Dr, Knightdale, NC 27545 and is currently estimated at $420,447, approximately $152 per square foot. 4009 Twin Spires Dr is a home located in Wake County with nearby schools including Knightdale Elementary School, Neuse River Middle School, and Knightdale High.
Ownership History
Date
Name
Owned For
Owner Type
Purchase Details
Closed on
Apr 7, 2017
Sold by
Wright Romaine
Bought by
Bingler Ebiily D and Bingler Laura
Current Estimated Value
Home Financials for this Owner
Home Financials are based on the most recent Mortgage that was taken out on this home.
Original Mortgage
$150,000
Outstanding Balance
$124,445
Interest Rate
4.1%
Mortgage Type
New Conventional
Estimated Equity
$296,002
Purchase Details
Closed on
Sep 21, 2009
Sold by
Sirva Relocation Credit Llc
Bought by
Wright Romaine
Home Financials for this Owner
Home Financials are based on the most recent Mortgage that was taken out on this home.
Original Mortgage
$186,224
Interest Rate
5.22%
Mortgage Type
New Conventional
Purchase Details
Closed on
Jul 30, 2007
Sold by
Centex Homes
Bought by
Tapp Elaine M and Tapp Anthony L
Home Financials for this Owner
Home Financials are based on the most recent Mortgage that was taken out on this home.
Original Mortgage
$223,220
Interest Rate
6.65%
Mortgage Type
Purchase Money Mortgage
Create a Home Valuation Report for This Property
The Home Valuation Report is an in-depth analysis detailing your home's value as well as a comparison with similar homes in the area
Home Values in the Area
Average Home Value in this Area
Purchase History
| Date | Buyer | Sale Price | Title Company |
|---|---|---|---|
| Bingler Ebiily D | $215,000 | None Available | |
| Wright Romaine | $182,500 | None Available | |
| Sirva Relocation Credit Llc | $182,500 | None Available | |
| Tapp Elaine M | $223,500 | None Available |
Source: Public Records
Mortgage History
| Date | Status | Borrower | Loan Amount |
|---|---|---|---|
| Open | Bingler Ebiily D | $150,000 | |
| Previous Owner | Sirva Relocation Credit Llc | $186,224 | |
| Previous Owner | Tapp Elaine M | $223,220 |
Source: Public Records
Tax History Compared to Growth
Tax History
| Year | Tax Paid | Tax Assessment Tax Assessment Total Assessment is a certain percentage of the fair market value that is determined by local assessors to be the total taxable value of land and additions on the property. | Land | Improvement |
|---|---|---|---|---|
| 2025 | $3,897 | $405,028 | $70,000 | $335,028 |
| 2024 | $3,882 | $405,028 | $70,000 | $335,028 |
| 2023 | $3,019 | $270,921 | $40,000 | $230,921 |
| 2022 | $2,918 | $270,921 | $40,000 | $230,921 |
| 2021 | $2,783 | $270,921 | $40,000 | $230,921 |
| 2020 | $2,783 | $270,921 | $40,000 | $230,921 |
| 2019 | $2,493 | $214,912 | $40,000 | $174,912 |
| 2018 | $2,351 | $214,912 | $40,000 | $174,912 |
| 2017 | $2,266 | $214,912 | $40,000 | $174,912 |
| 2016 | $2,235 | $214,912 | $40,000 | $174,912 |
| 2015 | $2,215 | $210,115 | $43,000 | $167,115 |
| 2014 | $2,138 | $210,115 | $43,000 | $167,115 |
Source: Public Records
Map
Nearby Homes
- 1227 Sunday Silence Dr
- 2523 Ferdinand Dr
- 2111 Old Rosebud Dr
- 1209 Agile Dr
- 4611 Dr
- 4707 Smarty Jones Dr
- 4809 Smarty Jones Dr
- 603 Calavaras Ln
- 619 Laurens Way
- 1442 Jay Rd
- 1452 Jay Rd
- 1500 Wader Cir
- 1456 Jay Rd
- 1516 Wader Cir
- 1463 Jay Rd
- 1448 Jay Rd
- 1700 Goldfinch Perch Ln
- 1580 Goldfinch Perch Ln
- 444 Haywood Glen Dr
- 1512 Wader Cir
- 4011 Twin Spires Dr
- 4001 Twin Spires Dr
- 4005 Twin Spires Dr
- 4015 Twin Spires Dr
- 4008 Twin Spires Dr
- 4006 Twin Spires Dr
- 4010 Twin Spires Dr
- 4012 Twin Spires Dr
- 4002 Twin Spires Dr
- 4017 Twin Spires Dr
- 4003 Twin Spires Dr
- 4014 Twin Spires Dr
- 1302 Sunday Silence Dr
- 1236 Sunday Silence Dr
- 4101 Twin Spires Dr
- 4204 Monarches Dr
- 4204 Monarchos Dr
- 4102 Twin Spires Dr
- 1304 Sunday Silence Dr
- 1234 Sunday Silence Dr