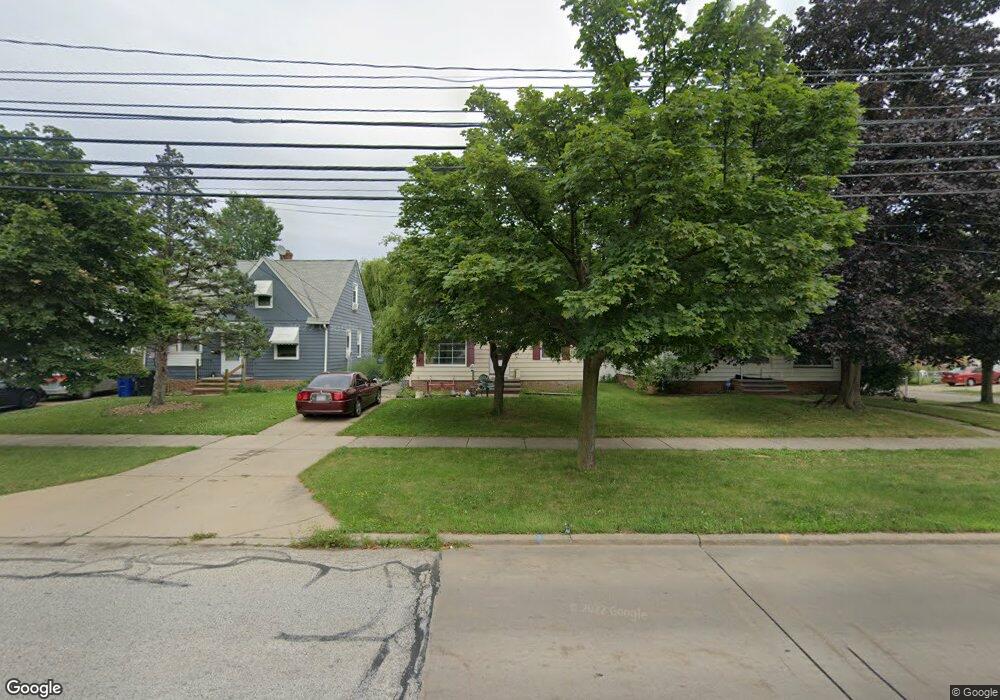
4009 W 140th St Cleveland, OH 44135
Bellaire-Puritas NeighborhoodEstimated Value: $124,381 - $145,000
2
Beds
1
Bath
1,131
Sq Ft
$119/Sq Ft
Est. Value
About This Home
This home is located at 4009 W 140th St, Cleveland, OH 44135 and is currently estimated at $134,595, approximately $119 per square foot. 4009 W 140th St is a home located in Cuyahoga County with nearby schools including Artemus Ward School, Almira Academy, and Benjamin Franklin.
Ownership History
Date
Name
Owned For
Owner Type
Purchase Details
Closed on
Jun 9, 2007
Sold by
Deutsche Bank National Trust Co
Bought by
Partin Christopher M
Current Estimated Value
Home Financials for this Owner
Home Financials are based on the most recent Mortgage that was taken out on this home.
Original Mortgage
$34,875
Interest Rate
6.54%
Mortgage Type
Purchase Money Mortgage
Purchase Details
Closed on
May 10, 2007
Sold by
Malone Patricia Jayne
Bought by
Deutsche Bank National Trust Co
Home Financials for this Owner
Home Financials are based on the most recent Mortgage that was taken out on this home.
Original Mortgage
$34,875
Interest Rate
6.54%
Mortgage Type
Purchase Money Mortgage
Purchase Details
Closed on
Sep 29, 1989
Sold by
Lukek Alice
Bought by
Malone Patricia Jayne
Purchase Details
Closed on
Jun 12, 1984
Sold by
Filipic Mathew
Bought by
Lukek Alice
Purchase Details
Closed on
Jan 1, 1975
Bought by
Filipic Mathew
Create a Home Valuation Report for This Property
The Home Valuation Report is an in-depth analysis detailing your home's value as well as a comparison with similar homes in the area
Home Values in the Area
Average Home Value in this Area
Purchase History
| Date | Buyer | Sale Price | Title Company |
|---|---|---|---|
| Partin Christopher M | $46,500 | Landcastle | |
| Deutsche Bank National Trust Co | $41,333 | Attorney | |
| Malone Patricia Jayne | $46,000 | -- | |
| Lukek Alice | -- | -- | |
| Filipic Mathew | -- | -- |
Source: Public Records
Mortgage History
| Date | Status | Borrower | Loan Amount |
|---|---|---|---|
| Previous Owner | Partin Christopher M | $34,875 |
Source: Public Records
Tax History Compared to Growth
Tax History
| Year | Tax Paid | Tax Assessment Tax Assessment Total Assessment is a certain percentage of the fair market value that is determined by local assessors to be the total taxable value of land and additions on the property. | Land | Improvement |
|---|---|---|---|---|
| 2024 | $2,341 | $35,000 | $7,245 | $27,755 |
| 2023 | $1,962 | $25,310 | $5,390 | $19,920 |
| 2022 | $1,951 | $25,305 | $5,390 | $19,915 |
| 2021 | $1,933 | $25,310 | $5,390 | $19,920 |
| 2020 | $1,732 | $19,600 | $4,170 | $15,440 |
| 2019 | $1,604 | $56,000 | $11,900 | $44,100 |
| 2018 | $1,261 | $19,600 | $4,170 | $15,440 |
| 2017 | $930 | $11,000 | $3,330 | $7,670 |
| 2016 | $923 | $11,000 | $3,330 | $7,670 |
| 2015 | $976 | $11,000 | $3,330 | $7,670 |
| 2014 | $976 | $11,590 | $3,500 | $8,090 |
Source: Public Records
Map
Nearby Homes
- 13818 Courtland Ave
- 13921 Wainstead Ave
- 13716 Tyler Ave
- 14212 Leroy Ave
- 13514 Tyler Ave
- 4046 W 143rd St
- 4162 Victory Blvd
- 13910 Lyric Ave
- 13904 Highlandview Ave
- 14128 Lakota Ave
- 3922 W 143rd St
- 14315 Viola Ave
- 14434 Cleminshaw Rd
- 14513 Mission Rd
- 3918 Brookside Blvd
- 14011 Saint James Ave
- 13301 Courtland Ave
- 4176 W 143rd St
- 3878 W 134th St
- 13328 West Ave
- 4005 W 140th St
- 4013 W 140th St
- 4001 W 140th St
- 13922 Clifford Ave
- 13918 Clifford Ave
- 3997 W 140th St
- 4021 W 140th St
- 13914 Clifford Ave
- 3993 W 140th St
- 13917 Courtland Ave
- 4025 W 140th St
- 13921 Clifford Ave
- 13910 Clifford Ave
- 13913 Courtland Ave
- 4010 W 140th St
- 4006 W 140th St
- 4014 W 140th St
- 4002 W 140th St
- 13917 Clifford Ave
- 4029 W 140th St