Estimated Value: $1,681,431 - $2,272,000
3
Beds
3
Baths
1,905
Sq Ft
$1,025/Sq Ft
Est. Value
About This Home
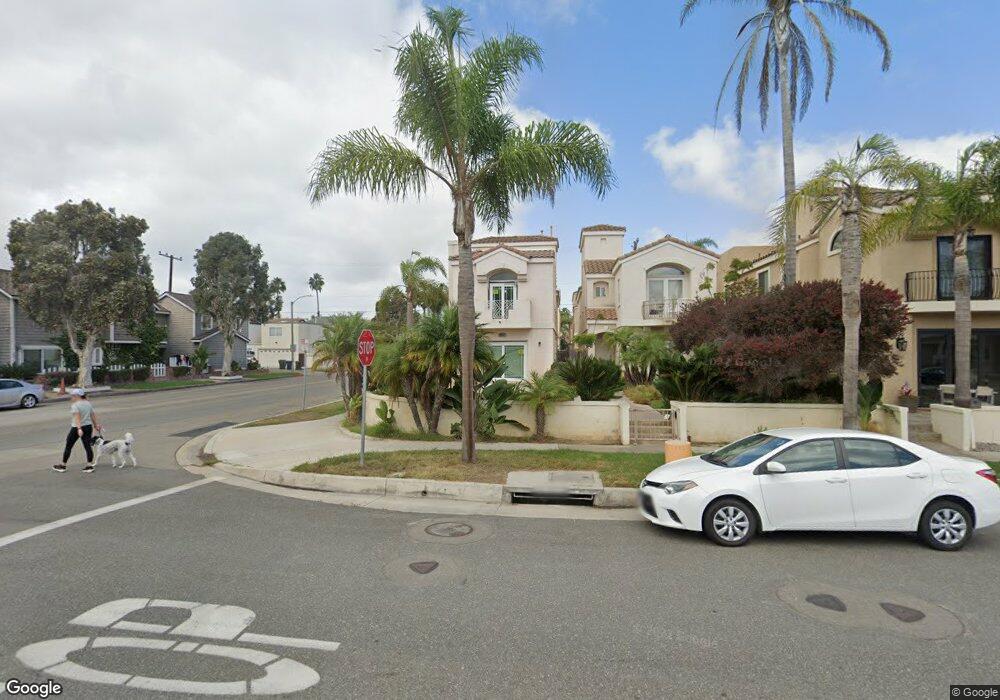
This home is located at 401 21st St, Huntington Beach, CA 92648 and is currently estimated at $1,952,858, approximately $1,025 per square foot. 401 21st St is a home located in Orange County with nearby schools including Agnes L. Smith Elementary, Ethel Dwyer Middle, and Huntington Beach High School.
Ownership History
Date
Name
Owned For
Owner Type
Purchase Details
Closed on
Jul 20, 2007
Sold by
Mond Alex
Bought by
Chang Jennifer Wen Hua
Current Estimated Value
Purchase Details
Closed on
Sep 19, 2006
Sold by
Mond Alex
Bought by
Mond Alex and The Alex Mond Trust
Purchase Details
Closed on
Aug 5, 1999
Sold by
Martin Harry
Bought by
Mond Alex
Home Financials for this Owner
Home Financials are based on the most recent Mortgage that was taken out on this home.
Original Mortgage
$352,500
Interest Rate
7.87%
Purchase Details
Closed on
Sep 3, 1998
Sold by
Wally Stefan and Hurley Amy E
Bought by
Martin Harry
Home Financials for this Owner
Home Financials are based on the most recent Mortgage that was taken out on this home.
Original Mortgage
$340,000
Interest Rate
5.5%
Mortgage Type
VA
Purchase Details
Closed on
Aug 17, 1997
Sold by
Macleod David A and Macleod Nancy J
Bought by
Wally Stefan and Hurley Amy E
Home Financials for this Owner
Home Financials are based on the most recent Mortgage that was taken out on this home.
Original Mortgage
$287,200
Interest Rate
6.95%
Create a Home Valuation Report for This Property
The Home Valuation Report is an in-depth analysis detailing your home's value as well as a comparison with similar homes in the area
Home Values in the Area
Average Home Value in this Area
Purchase History
| Date | Buyer | Sale Price | Title Company |
|---|---|---|---|
| Chang Jennifer Wen Hua | $999,000 | Ticor Title Co Of California | |
| Mond Alex | -- | None Available | |
| Mond Alex | $469,000 | First American Title Ins Co | |
| Martin Harry | $425,000 | Commonwealth Land Title | |
| Wally Stefan | $359,000 | Old Republic Title |
Source: Public Records
Mortgage History
| Date | Status | Borrower | Loan Amount |
|---|---|---|---|
| Previous Owner | Mond Alex | $352,500 | |
| Previous Owner | Martin Harry | $340,000 | |
| Previous Owner | Wally Stefan | $287,200 |
Source: Public Records
Tax History Compared to Growth
Tax History
| Year | Tax Paid | Tax Assessment Tax Assessment Total Assessment is a certain percentage of the fair market value that is determined by local assessors to be the total taxable value of land and additions on the property. | Land | Improvement |
|---|---|---|---|---|
| 2025 | $14,576 | $1,312,200 | $1,000,821 | $311,379 |
| 2024 | $14,576 | $1,286,471 | $981,197 | $305,274 |
| 2023 | $14,254 | $1,261,247 | $961,958 | $299,289 |
| 2022 | $13,882 | $1,236,517 | $943,096 | $293,421 |
| 2021 | $13,624 | $1,212,272 | $924,604 | $287,668 |
| 2020 | $13,537 | $1,199,842 | $915,123 | $284,719 |
| 2019 | $13,373 | $1,176,316 | $897,179 | $279,137 |
| 2018 | $13,167 | $1,153,251 | $879,587 | $273,664 |
| 2017 | $12,993 | $1,130,639 | $862,340 | $268,299 |
| 2016 | $12,408 | $1,108,470 | $845,431 | $263,039 |
| 2015 | $11,374 | $1,008,000 | $770,936 | $237,064 |
| 2014 | $9,905 | $875,560 | $638,496 | $237,064 |
Source: Public Records
Map
Nearby Homes
- 411 22nd St
- 412 20th St
- 304 Goldenwest St
- 419 18th St
- 2000 Pacific Coast Hwy Unit 313
- 2000 Pacific Coast Hwy Unit 103
- 2000 Pacific Coast Hwy Unit 309
- 620 22nd St
- 304 18th St
- 302 18th St
- 521 18th St
- 627 19th St
- 505 17th St
- 306 17th St
- 6776 Findley Cir
- 125 16th St
- 19811 Deep Harbor Dr
- 1516 Pacific Coast Hwy Unit 101
- 416 15th St
- 319 14th St Unit B