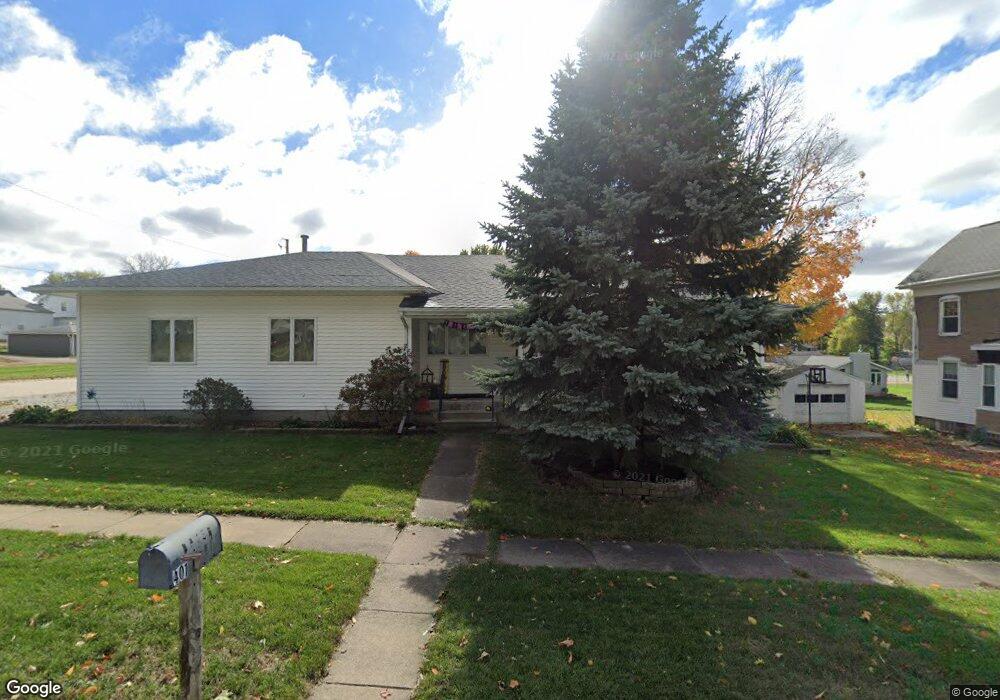
401 5th St Victor, IA 52347
Estimated Value: $171,000 - $206,000
2
Beds
3
Baths
1,712
Sq Ft
$110/Sq Ft
Est. Value
About This Home
This home is located at 401 5th St, Victor, IA 52347 and is currently estimated at $188,247, approximately $109 per square foot. 401 5th St is a home located in Iowa County.
Ownership History
Date
Name
Owned For
Owner Type
Purchase Details
Closed on
Nov 19, 2018
Sold by
Blood Alyssa S and Blood Lucas P
Bought by
Licht Jessica
Current Estimated Value
Home Financials for this Owner
Home Financials are based on the most recent Mortgage that was taken out on this home.
Original Mortgage
$136,770
Outstanding Balance
$120,262
Interest Rate
4.8%
Mortgage Type
New Conventional
Estimated Equity
$67,985
Purchase Details
Closed on
Jul 13, 2010
Sold by
Felton Vickie J
Bought by
May Andrew J and May Tara K
Home Financials for this Owner
Home Financials are based on the most recent Mortgage that was taken out on this home.
Original Mortgage
$125,000
Interest Rate
4.54%
Mortgage Type
VA
Create a Home Valuation Report for This Property
The Home Valuation Report is an in-depth analysis detailing your home's value as well as a comparison with similar homes in the area
Home Values in the Area
Average Home Value in this Area
Purchase History
| Date | Buyer | Sale Price | Title Company |
|---|---|---|---|
| Licht Jessica | $141,000 | None Available | |
| May Andrew J | $125,000 | None Available |
Source: Public Records
Mortgage History
| Date | Status | Borrower | Loan Amount |
|---|---|---|---|
| Open | Licht Jessica | $136,770 | |
| Previous Owner | May Andrew J | $125,000 |
Source: Public Records
Tax History Compared to Growth
Tax History
| Year | Tax Paid | Tax Assessment Tax Assessment Total Assessment is a certain percentage of the fair market value that is determined by local assessors to be the total taxable value of land and additions on the property. | Land | Improvement |
|---|---|---|---|---|
| 2024 | $2,522 | $158,040 | $19,670 | $138,370 |
| 2023 | $2,338 | $158,040 | $19,670 | $138,370 |
| 2022 | $2,286 | $126,110 | $19,670 | $106,440 |
| 2021 | $2,454 | $126,110 | $19,670 | $106,440 |
| 2020 | $2,392 | $128,060 | $17,960 | $110,100 |
| 2019 | $2,184 | $128,060 | $17,960 | $110,100 |
| 2018 | $2,120 | $121,570 | $16,250 | $105,320 |
| 2017 | $2,032 | $121,570 | $16,250 | $105,320 |
| 2016 | $1,962 | $115,950 | $16,250 | $99,700 |
| 2015 | $1,962 | $115,950 | $16,250 | $99,700 |
| 2014 | $2,044 | $119,300 | $16,250 | $103,050 |
Source: Public Records
Map
Nearby Homes