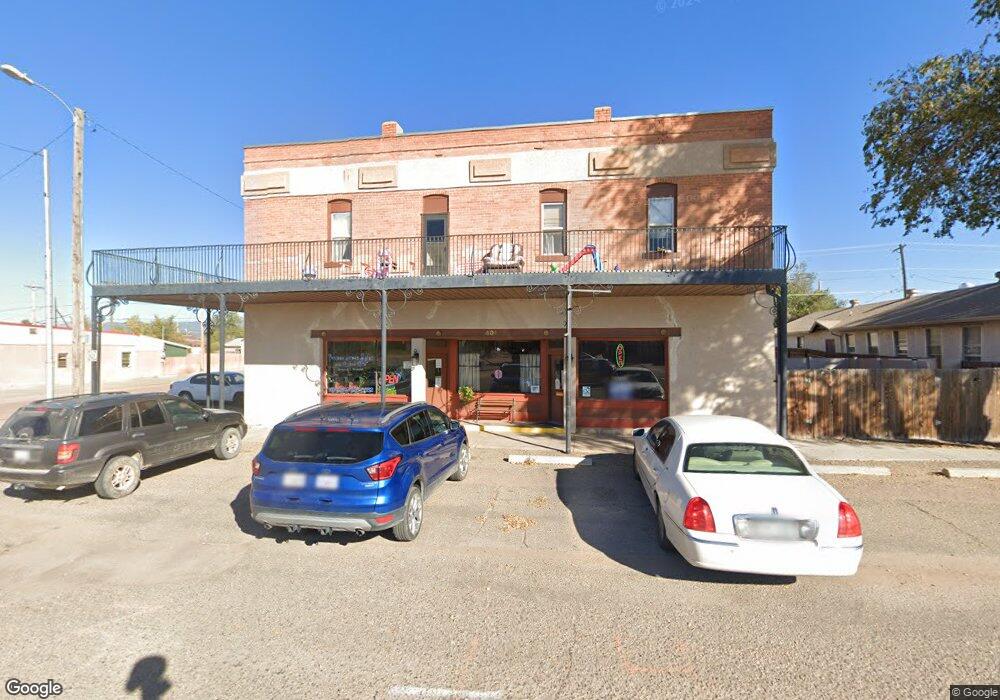
401 Broadway St Penrose, CO 81240
Estimated Value: $296,000 - $560,000
9
Beds
5
Baths
5,364
Sq Ft
$88/Sq Ft
Est. Value
About This Home
This home is located at 401 Broadway St, Penrose, CO 81240 and is currently estimated at $473,349, approximately $88 per square foot. 401 Broadway St is a home located in Fremont County with nearby schools including Penrose Elementary School and Florence High School.
Ownership History
Date
Name
Owned For
Owner Type
Purchase Details
Closed on
Feb 26, 2021
Sold by
Gjelsness Homes Llc
Bought by
The Pen Mac Builders Llc
Current Estimated Value
Purchase Details
Closed on
May 1, 2018
Sold by
Gjelsness Investments Inc
Bought by
Gjelsness Homes Llc
Purchase Details
Closed on
May 29, 2015
Sold by
The Dorene M Mitchell Family Trust
Bought by
Gjelsness Kendall Ray and Gjelsness Connie Kay
Purchase Details
Closed on
Feb 6, 2013
Sold by
Mitchell Dorene and Stone Edward R
Bought by
The Dorene M Mitchell Family Trust
Purchase Details
Closed on
Apr 28, 2009
Sold by
Stone Dawn L Wallace and Stone Edward R
Bought by
Mitchell Dorene and Stone Edward R
Purchase Details
Closed on
Apr 13, 2009
Sold by
Mitchell Dorene M
Bought by
Stone Edward R and Wallace Dawn L
Purchase Details
Closed on
May 26, 2005
Sold by
Short Michael Gary
Bought by
Mitchell Dorene M
Create a Home Valuation Report for This Property
The Home Valuation Report is an in-depth analysis detailing your home's value as well as a comparison with similar homes in the area
Home Values in the Area
Average Home Value in this Area
Purchase History
| Date | Buyer | Sale Price | Title Company |
|---|---|---|---|
| The Pen Mac Builders Llc | $410,000 | Empire Title Co Springs Llc | |
| Gjelsness Homes Llc | -- | None Available | |
| Gjelsness Kendall Ray | $250,000 | Fidelity National Title | |
| The Dorene M Mitchell Family Trust | -- | None Available | |
| Mitchell Dorene | -- | None Available | |
| Stone Edward R | -- | None Available | |
| Mitchell Dorene M | -- | None Available |
Source: Public Records
Tax History Compared to Growth
Tax History
| Year | Tax Paid | Tax Assessment Tax Assessment Total Assessment is a certain percentage of the fair market value that is determined by local assessors to be the total taxable value of land and additions on the property. | Land | Improvement |
|---|---|---|---|---|
| 2024 | $2,360 | $44,315 | $0 | $0 |
| 2023 | $2,360 | $32,260 | $0 | $0 |
| 2022 | $2,311 | $31,909 | $0 | $0 |
| 2021 | $2,295 | $32,210 | $0 | $0 |
| 2020 | $1,820 | $29,849 | $0 | $0 |
| 2019 | $1,828 | $29,849 | $0 | $0 |
| 2018 | $1,874 | $30,674 | $0 | $0 |
| 2017 | $1,878 | $30,674 | $0 | $0 |
| 2016 | $1,923 | $31,410 | $0 | $0 |
| 2015 | $1,899 | $31,410 | $0 | $0 |
| 2012 | $1,054 | $16,068 | $1,941 | $14,127 |
Source: Public Records
Map
Nearby Homes
- Na *Unassigned
- 0 N Broadway Unit na 92878
- 0 N Broadway Unit na 92873
- 0 N Broadway Unit na 92877
- 0 N Broadway Unit na 92876
- 0 N Broadway Unit 51362
- 0 N Broadway Unit 51361
- 0 N Broadway Unit 51364
- 0 N Broadway Unit 51360
- 0 N Broadway Unit 51359
- 0 N Broadway Unit 29250
- 0 N Broadway Unit 29248
- 0 N Broadway Unit 32136
- 0 N Broadway Unit 29249
- 0 N Broadway Unit 29251
- 0 N Broadway Unit 29247
- 0 N Broadway Unit 4 106681
- 0 N Broadway Unit 149592
- 0 N Broadway Unit 149592
- n/a Grant St Unit 22