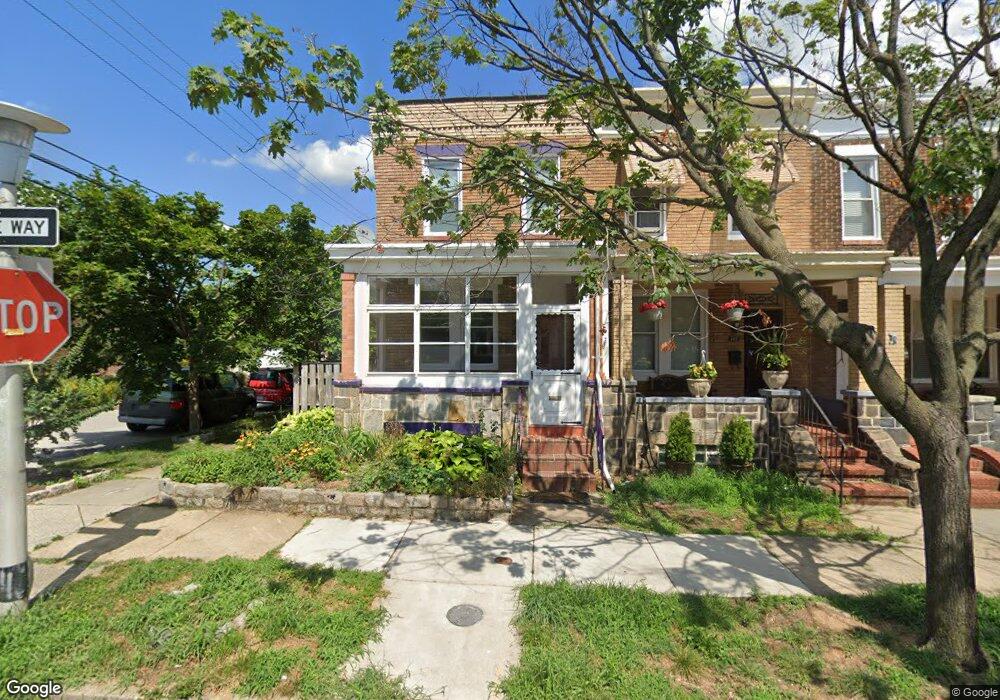
401 Cornwall St Baltimore, MD 21224
Bayview NeighborhoodEstimated Value: $193,877 - $257,000
Studio
1
Bath
1,368
Sq Ft
$165/Sq Ft
Est. Value
About This Home
This home is located at 401 Cornwall St, Baltimore, MD 21224 and is currently estimated at $225,439, approximately $164 per square foot. 401 Cornwall St is a home located in Baltimore City with nearby schools including John Ruhrah Elementary School, Booker T. Washington Middle School, and Patterson High School.
Ownership History
Date
Name
Owned For
Owner Type
Purchase Details
Closed on
Sep 19, 2019
Sold by
Wolf Keith Martin and Akers Wolf Teresa Lea
Bought by
Santiago Bryan
Current Estimated Value
Home Financials for this Owner
Home Financials are based on the most recent Mortgage that was taken out on this home.
Original Mortgage
$152,192
Outstanding Balance
$135,411
Interest Rate
4.4%
Mortgage Type
FHA
Estimated Equity
$90,028
Purchase Details
Closed on
Jun 28, 1996
Sold by
Wojtek Thomas R
Bought by
Wolf Keith Martin and Wolf Theresa Lea A
Create a Home Valuation Report for This Property
The Home Valuation Report is an in-depth analysis detailing your home's value as well as a comparison with similar homes in the area
Home Values in the Area
Average Home Value in this Area
Purchase History
| Date | Buyer | Sale Price | Title Company |
|---|---|---|---|
| Santiago Bryan | $155,000 | Universal Title | |
| Wolf Keith Martin | $65,000 | -- |
Source: Public Records
Mortgage History
| Date | Status | Borrower | Loan Amount |
|---|---|---|---|
| Open | Santiago Bryan | $152,192 |
Source: Public Records
Tax History
| Year | Tax Paid | Tax Assessment Tax Assessment Total Assessment is a certain percentage of the fair market value that is determined by local assessors to be the total taxable value of land and additions on the property. | Land | Improvement |
|---|---|---|---|---|
| 2025 | $2,835 | $178,900 | $25,000 | $153,900 |
| 2024 | $2,835 | $168,167 | -- | -- |
| 2023 | $2,691 | $157,433 | $0 | $0 |
| 2022 | $2,650 | $146,700 | $25,000 | $121,700 |
| 2021 | $3,104 | $131,533 | $0 | $0 |
| 2020 | $2,402 | $116,367 | $0 | $0 |
| 2019 | $2,162 | $101,200 | $25,000 | $76,200 |
| 2018 | $2,184 | $100,633 | $0 | $0 |
| 2017 | $2,195 | $100,067 | $0 | $0 |
| 2016 | $2,018 | $99,500 | $0 | $0 |
| 2015 | $2,018 | $99,500 | $0 | $0 |
| 2014 | $2,018 | $99,500 | $0 | $0 |
Source: Public Records
Map
Nearby Homes
Your Personal Tour Guide
Ask me questions while you tour the home.