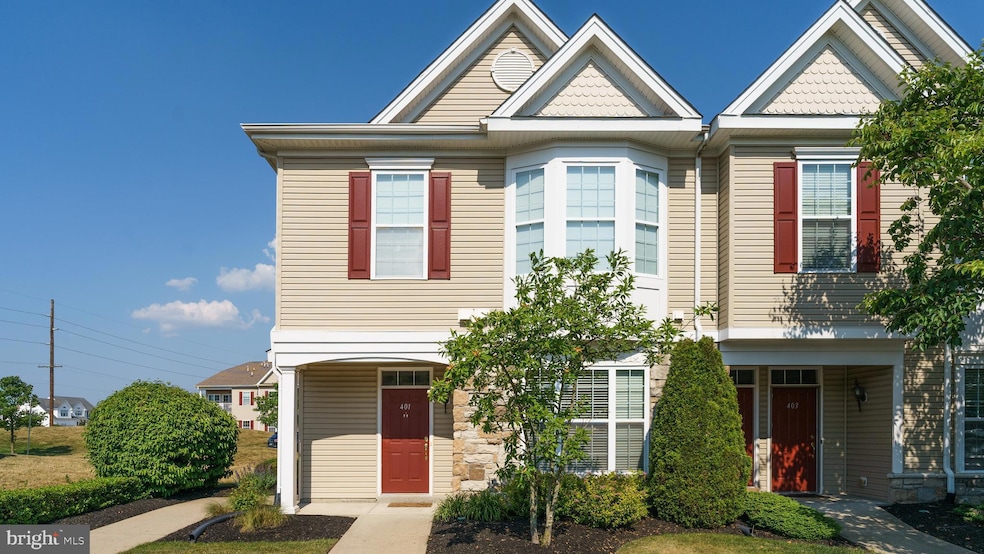
401 Degas Ct Unit 401 Williamstown, NJ 08094
Monroe Township Gloucester NeighborhoodHighlights
- Penthouse
- Community Pool
- Forced Air Heating and Cooling System
- Colonial Architecture
About This Home
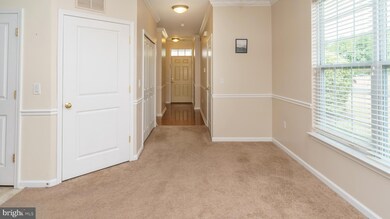
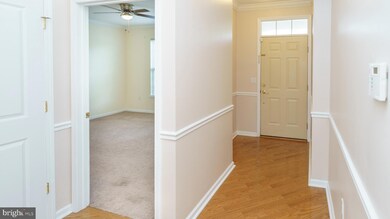
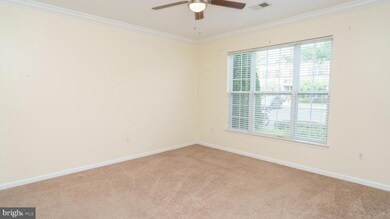
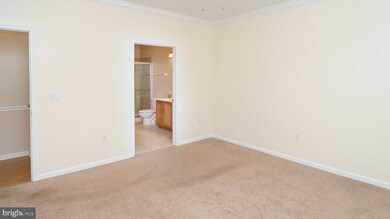
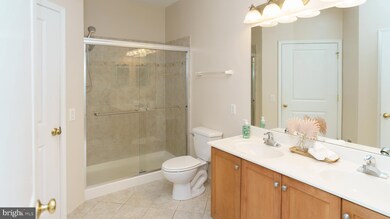
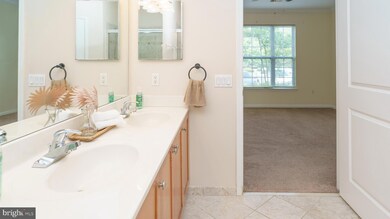
Spacious 2-bedroom, 2 full bathroom first floor, end unit condo available for rent in the desirable Amberleigh community! Enjoy great features such as a large primary bedroom suite with double vanity, linen closet, and walk-in closet. 2nd full bathroom is equally spacious with a tub shower. Sliding door access to the back patio. Excellent amenities such as the clubhouse, fitness center, and swimming pool. Convenient pantry and breakfast bar in the kitchen. Lots of closet space! Easy access to all major highways and shopping areas. Photos show the property staged before the current tenant moved in. Available for move-in starting October 15th.
Listing Agent
(856) 373-0405 kcraighomesales@gmail.com Real Broker, LLC License #2298843 Listed on: 09/25/2025

Co-Listing Agent
(732) 705-7124 rachaelnbane@gmail.com Real Broker, LLC License #1863724
Condo Details
Home Type
- Condominium
Est. Annual Taxes
- $4,805
Year Built
- Built in 2008
Parking
- Parking Lot
Home Design
- Penthouse
- Colonial Architecture
- Entry on the 1st floor
- Stone Siding
- Vinyl Siding
Interior Spaces
- 1,152 Sq Ft Home
- Property has 1 Level
- Washer and Dryer Hookup
Bedrooms and Bathrooms
- 2 Main Level Bedrooms
- 2 Full Bathrooms
Utilities
- Forced Air Heating and Cooling System
- Natural Gas Water Heater
Listing and Financial Details
- Residential Lease
- Security Deposit $3,375
- Tenant pays for all utilities
- No Smoking Allowed
- 12-Month Lease Term
- Available 10/15/25
- Assessor Parcel Number 11-001100407-00087-C401
Community Details
Overview
- Low-Rise Condominium
- Amberleigh At The Ar Subdivision
Recreation
- Community Pool
Pet Policy
- Pets allowed on a case-by-case basis
- Pet Size Limit
Map
Source: Bright MLS
MLS Number: NJGL2064574
APN: 11-00110-0407-00087-0000-C401
Disclaimer: Certain information contained herein is derived from information provided by parties other than Homes.com. All information provided is deemed reliable, but is not guaranteed to be accurate and should be independently verified.
![]() The data relating to real estate for sale on this website appears in part through the BRIGHT Internet Data Exchange program, a voluntary cooperative exchange of property listing data between licensed real estate brokerage firms, and is provided by BRIGHT through a licensing agreement.
The data relating to real estate for sale on this website appears in part through the BRIGHT Internet Data Exchange program, a voluntary cooperative exchange of property listing data between licensed real estate brokerage firms, and is provided by BRIGHT through a licensing agreement.
Listing information is from various brokers who participate in the Bright MLS IDX program and not all listings may be visible on the site.
The property information being provided on or through the website is for the personal, non-commercial use of consumers and such information may not be used for any purpose other than to identify prospective properties consumers may be interested in purchasing.
Some properties which appear for sale on the website may no longer be available because they are for instance, under contract, sold or are no longer being offered for sale.
Property information displayed is deemed reliable but is not guaranteed.
Copyright 2025 Bright MLS, Inc.
- 206 Raphael Ct
- 505 Matisse Way Unit 505
- 2406 Exposition Dr Unit 2406
- 1406 Exposition Dr
- 1121 Lafayette St
- 1638 Red Oak Rd
- 1605 Pin Oak Rd
- 1602 Pin Oak Rd
- 1735 Black Oak Rd
- 943 Sykesville Rd
- 1017 Micawber Dr
- 1137 S Beecham Rd
- 1601 White Oak Ln
- 1008 London Cir
- 304 Thackeray Ln
- 1011 S Beecham Rd
- 415 Stockton Loop
- 934 N Beecham Rd
- 112 Hemlock Dr
- 640 Ironwood Dr