Estimated Value: $763,556 - $866,000
4
Beds
2
Baths
1,304
Sq Ft
$623/Sq Ft
Est. Value
About This Home
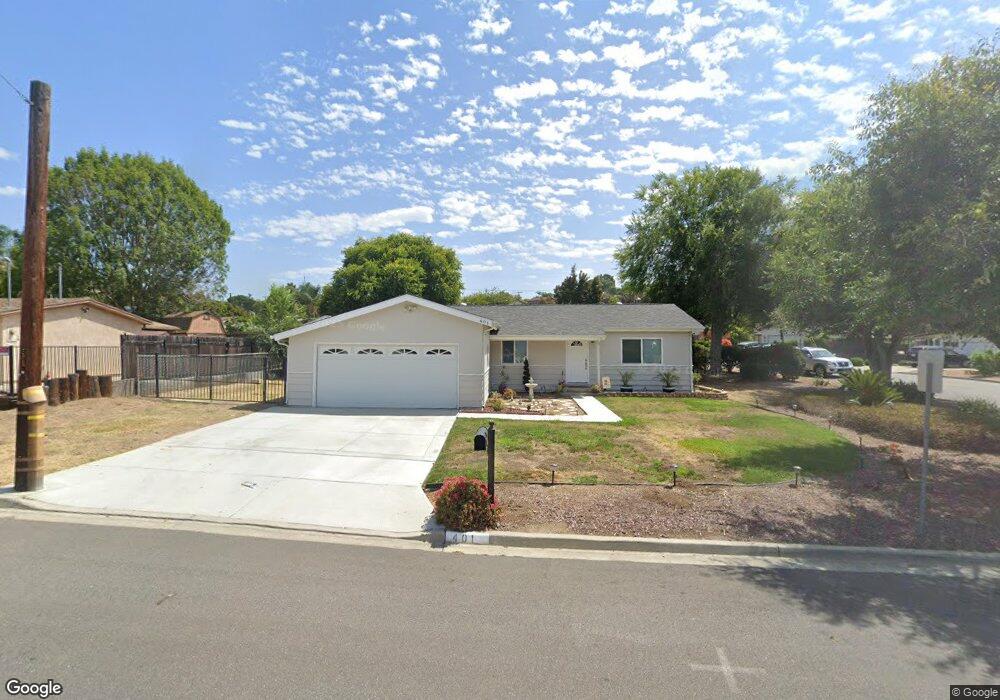
This home is located at 401 Durian St, Vista, CA 92083 and is currently estimated at $812,639, approximately $623 per square foot. 401 Durian St is a home located in San Diego County with nearby schools including Grapevine Elementary School, Madison Middle School, and Rancho Buena Vista High School.
Ownership History
Date
Name
Owned For
Owner Type
Purchase Details
Closed on
Aug 11, 2015
Sold by
Macleod Donald A and Macleod Roberta G
Bought by
The Macleod Family Revocable Trust and Macleod Roberta G
Current Estimated Value
Home Financials for this Owner
Home Financials are based on the most recent Mortgage that was taken out on this home.
Original Mortgage
$178,075
Outstanding Balance
$105,731
Interest Rate
3.97%
Mortgage Type
New Conventional
Estimated Equity
$706,908
Purchase Details
Closed on
Jan 26, 2007
Sold by
Macleod Donald A and Macleod Roberta G
Bought by
Macleod Donald A and Macleod Roberta G
Purchase Details
Closed on
Oct 15, 1998
Sold by
Zalinski James S
Bought by
Macleod Donald A and Macleod Roberta G
Home Financials for this Owner
Home Financials are based on the most recent Mortgage that was taken out on this home.
Original Mortgage
$143,332
Interest Rate
6.78%
Mortgage Type
FHA
Create a Home Valuation Report for This Property
The Home Valuation Report is an in-depth analysis detailing your home's value as well as a comparison with similar homes in the area
Home Values in the Area
Average Home Value in this Area
Purchase History
| Date | Buyer | Sale Price | Title Company |
|---|---|---|---|
| The Macleod Family Revocable Trust | -- | Tsi Title | |
| Macleod Donald A | -- | Tsi Title | |
| Macleod Donald A | -- | None Available | |
| Macleod Donald A | $145,000 | Fidelity National Title |
Source: Public Records
Mortgage History
| Date | Status | Borrower | Loan Amount |
|---|---|---|---|
| Open | Macleod Donald A | $178,075 | |
| Previous Owner | Macleod Donald A | $143,332 |
Source: Public Records
Tax History Compared to Growth
Tax History
| Year | Tax Paid | Tax Assessment Tax Assessment Total Assessment is a certain percentage of the fair market value that is determined by local assessors to be the total taxable value of land and additions on the property. | Land | Improvement |
|---|---|---|---|---|
| 2025 | $3,146 | $227,298 | $156,761 | $70,537 |
| 2024 | $3,146 | $222,842 | $153,688 | $69,154 |
| 2023 | $3,087 | $218,474 | $150,675 | $67,799 |
| 2022 | $3,079 | $214,191 | $147,721 | $66,470 |
| 2021 | $3,012 | $209,992 | $144,825 | $65,167 |
| 2020 | $2,990 | $207,839 | $143,340 | $64,499 |
| 2019 | $2,949 | $203,765 | $140,530 | $63,235 |
| 2018 | $2,839 | $199,771 | $137,775 | $61,996 |
| 2017 | $2,798 | $195,855 | $135,074 | $60,781 |
| 2016 | $2,734 | $192,016 | $132,426 | $59,590 |
| 2015 | $2,715 | $189,132 | $130,437 | $58,695 |
| 2014 | $2,653 | $185,428 | $127,882 | $57,546 |
Source: Public Records
Map
Nearby Homes
- 323 Hill Dr
- 233 Hill Dr
- 227 Hill Dr
- 1414 Janis Lynn Ln
- 523 Hatherly St
- 0 Galaxy Dr
- 211 Silver Fir Ct
- 1636 Jonathon St
- 320 Grapevine Rd Unit 9
- 202 Bay Laurel Ct
- 1713 Cameo Dr
- 933 Ruby Dr
- 748 Granada Dr
- 1283 Winchester Ct
- 1756 Promenade Cir
- 1333 Olive Ave Unit 54
- 1333 Olive Ave Unit 37
- 1333 Olive Ave Unit 62
- 1251 Remington Ct
- 2839 Emerald Dr