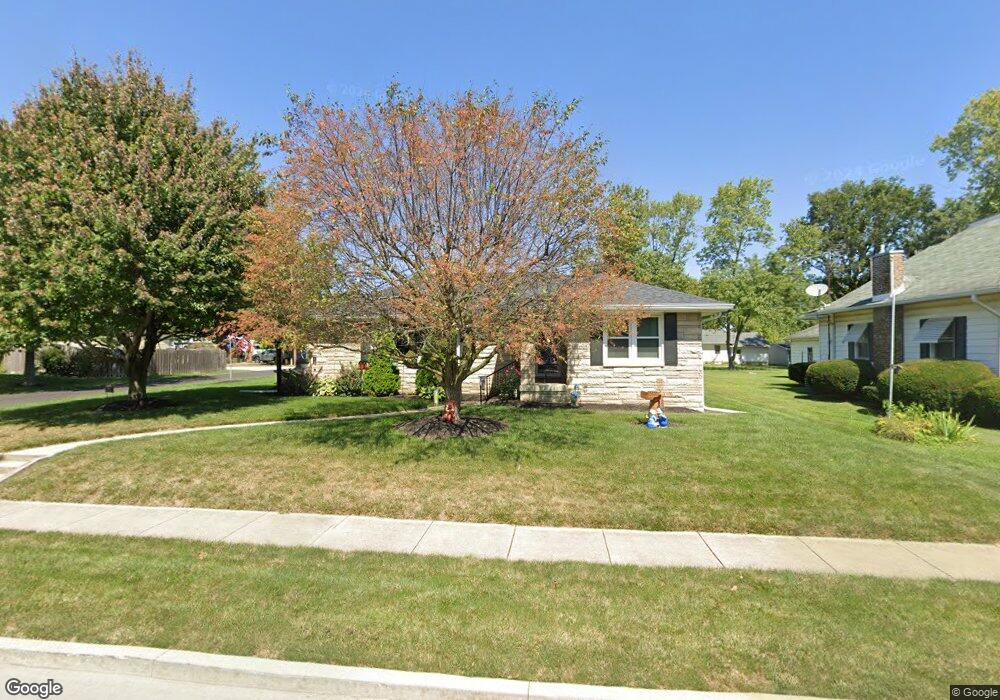
401 E 2nd St Sheridan, IN 46069
Estimated Value: $228,000 - $337,000
3
Beds
1
Bath
3,117
Sq Ft
$87/Sq Ft
Est. Value
About This Home
This home is located at 401 E 2nd St, Sheridan, IN 46069 and is currently estimated at $270,303, approximately $86 per square foot. 401 E 2nd St is a home located in Hamilton County with nearby schools including Sheridan Elementary School, Sheridan Middle School, and Sheridan High School.
Ownership History
Date
Name
Owned For
Owner Type
Purchase Details
Closed on
Mar 23, 2018
Sold by
Hall Steven
Bought by
Hall Steven and Hall Jetta
Current Estimated Value
Purchase Details
Closed on
Feb 27, 2013
Sold by
Pearson John W and Pearson John W
Bought by
Hall Frank S
Home Financials for this Owner
Home Financials are based on the most recent Mortgage that was taken out on this home.
Original Mortgage
$123,500
Outstanding Balance
$86,953
Interest Rate
3.49%
Mortgage Type
New Conventional
Estimated Equity
$183,350
Purchase Details
Closed on
Nov 10, 2009
Sold by
Pearson Phillip A
Bought by
Pearson John W and Pearson Linda S
Purchase Details
Closed on
Jan 25, 2008
Sold by
Pearson Larry J
Bought by
Pearson Larry J and Pearson Lucinda S
Purchase Details
Closed on
Dec 1, 2004
Sold by
Pearson A Berneice
Bought by
Pearson Larry J
Create a Home Valuation Report for This Property
The Home Valuation Report is an in-depth analysis detailing your home's value as well as a comparison with similar homes in the area
Home Values in the Area
Average Home Value in this Area
Purchase History
| Date | Buyer | Sale Price | Title Company |
|---|---|---|---|
| Hall Steven | -- | None Available | |
| Hall Streven | -- | None Available | |
| Hall Frank S | -- | None Available | |
| Pearson John W | -- | None Available | |
| Pearson Larry J | -- | None Available | |
| Pearson Larry J | -- | -- |
Source: Public Records
Mortgage History
| Date | Status | Borrower | Loan Amount |
|---|---|---|---|
| Open | Hall Frank S | $123,500 |
Source: Public Records
Tax History
| Year | Tax Paid | Tax Assessment Tax Assessment Total Assessment is a certain percentage of the fair market value that is determined by local assessors to be the total taxable value of land and additions on the property. | Land | Improvement |
|---|---|---|---|---|
| 2024 | $2,022 | $187,700 | $36,300 | $151,400 |
| 2023 | $2,047 | $182,100 | $36,300 | $145,800 |
| 2022 | $1,901 | $165,300 | $36,300 | $129,000 |
| 2021 | $1,772 | $154,200 | $36,300 | $117,900 |
| 2020 | $1,660 | $143,900 | $36,300 | $107,600 |
| 2019 | $1,689 | $146,400 | $15,200 | $131,200 |
| 2018 | $1,570 | $136,200 | $15,200 | $121,000 |
| 2017 | $2,915 | $126,900 | $15,200 | $111,700 |
| 2016 | $2,839 | $126,900 | $15,200 | $111,700 |
| 2014 | $2,427 | $110,800 | $25,700 | $85,100 |
| 2013 | $2,427 | $105,700 | $25,700 | $80,000 |
Source: Public Records
Map
Nearby Homes
- 514 E 2nd St
- 400 S Georgia St
- 903&905 S Georgia St
- 600 S Georgia St
- 108 W 3rd St
- 100 S California St
- 390 W State Road 38
- 24453 Kercheval St
- 707 S Hamilton Ave
- 24485 Godby St
- 3346 Godby Dr
- 3352 Godby Dr
- 24510 Godby St
- 24486 Godby St
- 3383 Greer St
- 24498 Godby St
- 3345 Godby Dr
- 407 W 8th St
- 606 W 2nd St
- 700 W 2nd St
Your Personal Tour Guide
Ask me questions while you tour the home.