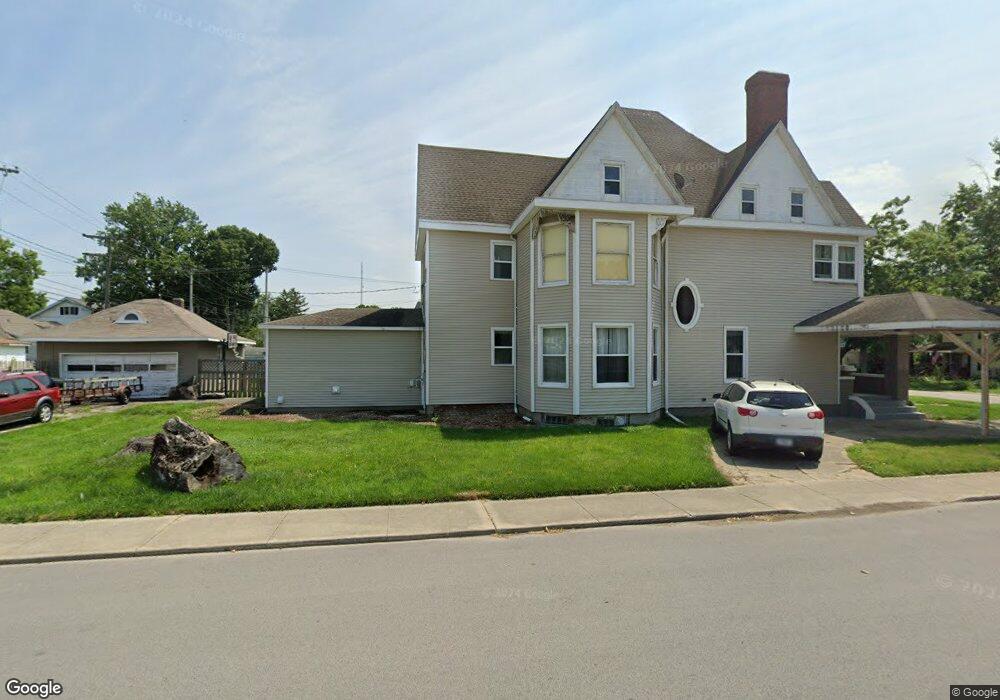
401 E 6th St Fowler, IN 47944
Estimated Value: $213,000 - $252,000
2
Beds
3
Baths
3,336
Sq Ft
$70/Sq Ft
Est. Value
About This Home
This home is located at 401 E 6th St, Fowler, IN 47944 and is currently estimated at $235,000, approximately $70 per square foot. 401 E 6th St is a home located in Benton County with nearby schools including Benton Central Junior/Senior High School and Sacred Heart Elementary School.
Ownership History
Date
Name
Owned For
Owner Type
Purchase Details
Closed on
Mar 1, 2022
Sold by
Braaksma Jason A
Bought by
Braaksma Jason A and Braaksma Marion B
Current Estimated Value
Home Financials for this Owner
Home Financials are based on the most recent Mortgage that was taken out on this home.
Original Mortgage
$157,500
Outstanding Balance
$145,130
Interest Rate
3.55%
Mortgage Type
New Conventional
Estimated Equity
$89,870
Purchase Details
Closed on
Oct 19, 2007
Sold by
Ballard Victor J
Bought by
Braaksma Jason A
Create a Home Valuation Report for This Property
The Home Valuation Report is an in-depth analysis detailing your home's value as well as a comparison with similar homes in the area
Purchase History
| Date | Buyer | Sale Price | Title Company |
|---|---|---|---|
| Braaksma Jason A | -- | None Listed On Document | |
| Braaksma Jason A | -- | -- |
Source: Public Records
Mortgage History
| Date | Status | Borrower | Loan Amount |
|---|---|---|---|
| Open | Braaksma Jason A | $157,500 |
Source: Public Records
Tax History
| Year | Tax Paid | Tax Assessment Tax Assessment Total Assessment is a certain percentage of the fair market value that is determined by local assessors to be the total taxable value of land and additions on the property. | Land | Improvement |
|---|---|---|---|---|
| 2025 | $2,871 | $244,900 | $10,900 | $234,000 |
| 2024 | $2,871 | $287,400 | $10,900 | $276,500 |
| 2023 | $2,893 | $253,400 | $9,600 | $243,800 |
| 2022 | $2,504 | $204,900 | $9,600 | $195,300 |
| 2021 | $2,013 | $164,400 | $9,600 | $154,800 |
| 2020 | $1,605 | $138,800 | $9,600 | $129,200 |
| 2019 | $1,615 | $147,300 | $9,600 | $137,700 |
| 2018 | $819 | $95,200 | $9,600 | $85,600 |
| 2017 | $1,015 | $93,800 | $9,600 | $84,200 |
| 2016 | $876 | $85,300 | $9,600 | $75,700 |
| 2014 | $742 | $76,300 | $8,600 | $67,700 |
| 2013 | $742 | $71,700 | $8,100 | $63,600 |
Source: Public Records
Map
Nearby Homes
- 502 E 5th St
- 501 E 7th St
- 202 N Van Buren Ave
- 503 E 8th St
- 303 N Jackson Ave
- 601 E 3rd St
- 307 N Madison Ave
- 201 S Grant Ave
- 305 N Lincoln Ave
- 111 W 4th St
- 307 N Washington Ave
- 902 E 8th St
- 909 E 7th St
- 909 E 8th St
- 703 W 2nd St
- Lot 9 W 2nd St
- 665 W 2nd St
- Lot 12 W 2nd St
- Lot 10 W 2nd St
- 653 W 2nd St
Your Personal Tour Guide
Ask me questions while you tour the home.