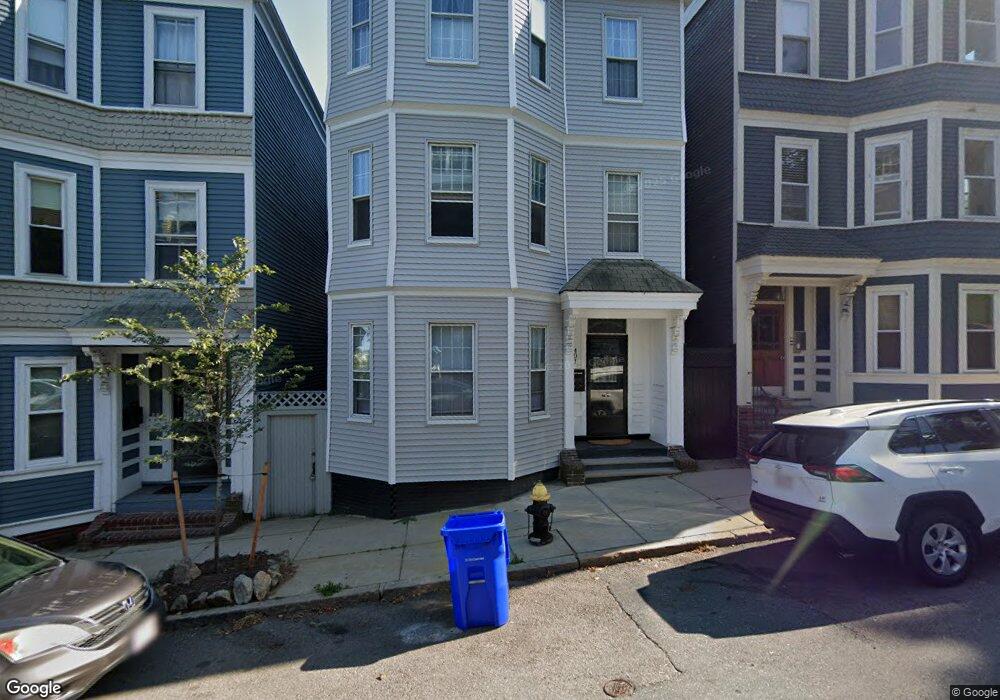
401 E 7th St Boston, MA 02127
South Boston NeighborhoodEstimated Value: $1,840,000 - $2,194,000
2
Beds
3
Baths
999
Sq Ft
$1,975/Sq Ft
Est. Value
About This Home
Newly renovated apartment on Southie's Eastside! Extremely spacious layout with generous bedroom sizes and living room! This unit also boasts a, private deck with views of the Boston Harbor! Conveniently located near bus stops, shops, and restaurants. LL paying for broker's fee. Owner pays water/ sewer. Tenant respo nsible for gas/ electric.*The base rent for this apartment is $4700, however, with tenant incentives,
73162 268
Ownership History
Date
Name
Owned For
Owner Type
Purchase Details
Closed on
Nov 10, 2016
Sold by
Laxton Wayne C
Bought by
Laxton Thomas and Broulilette Robin
Current Estimated Value
Create a Home Valuation Report for This Property
The Home Valuation Report is an in-depth analysis detailing your home's value as well as a comparison with similar homes in the area
Home Values in the Area
Average Home Value in this Area
Purchase History
| Date | Buyer | Sale Price | Title Company |
|---|---|---|---|
| Laxton Thomas | -- | -- |
Source: Public Records
Property History
| Date | Event | Price | List to Sale | Price per Sq Ft |
|---|---|---|---|---|
| 10/08/2024 10/08/24 | Off Market | $4,300 | -- | -- |
| 02/29/2024 02/29/24 | For Rent | $4,300 | -- | -- |
Tax History
| Year | Tax Paid | Tax Assessment Tax Assessment Total Assessment is a certain percentage of the fair market value that is determined by local assessors to be the total taxable value of land and additions on the property. | Land | Improvement |
|---|---|---|---|---|
| 2025 | $19,420 | $1,677,000 | $473,600 | $1,203,400 |
| 2024 | $17,079 | $1,566,900 | $367,300 | $1,199,600 |
| 2023 | $15,876 | $1,478,200 | $346,500 | $1,131,700 |
| 2022 | $14,530 | $1,335,500 | $315,000 | $1,020,500 |
| 2021 | $14,250 | $1,335,500 | $315,000 | $1,020,500 |
| 2020 | $12,897 | $1,221,300 | $298,400 | $922,900 |
| 2019 | $12,263 | $1,163,500 | $224,200 | $939,300 |
| 2018 | $11,616 | $1,108,400 | $224,200 | $884,200 |
| 2017 | $11,175 | $1,055,200 | $224,200 | $831,000 |
| 2016 | $10,094 | $917,600 | $224,200 | $693,400 |
| 2015 | $9,254 | $764,200 | $183,900 | $580,300 |
| 2014 | $8,176 | $649,900 | $183,900 | $466,000 |
Source: Public Records
Map
Nearby Homes
- 427 E 6th St Unit 3
- 84 G St Unit 3
- 84 G St Unit PH
- 53 Thomas Park Unit 2
- 20 Winfield St Unit 3
- 35 Story St Unit 2
- 51-53 Story St Unit 1
- 13 Pacific St
- 479 E 6th St
- 1306 Columbia Rd Unit 5C
- 2 Pacific St
- 511 E 8th St Unit 1
- 493 E 7th St
- 66 Gates St Unit 2
- 521 E 8th St Unit 6
- 480 E 4th St Unit 3
- 500 E 6th St
- 511 E 5th St Unit 3F
- 511 E 5th St Unit PH
- 511 E 5th St Unit 3R
- 401 E 7th St
- 401 E 7th St Unit 3
- 401 E 7th St Unit 2
- 401 E 7th St Unit 1
- 403 E 7th St
- 403 E 7th St Unit 1
- 403 E 7th St Unit 2
- 399 E 7th St Unit 2
- 399 E 7th St Unit 1
- 405 E 7th St
- 405 E 7th St Unit 2
- 405 E 7th St Unit 3
- 116 G St
- 116 G St Unit 1
- 116 G St Unit 2
- 118 G St
- 407 E 7th St
- 407 E 7th St
- 407 E 7th St Unit A
- 407 E 7th St Unit 1
Your Personal Tour Guide
Ask me questions while you tour the home.