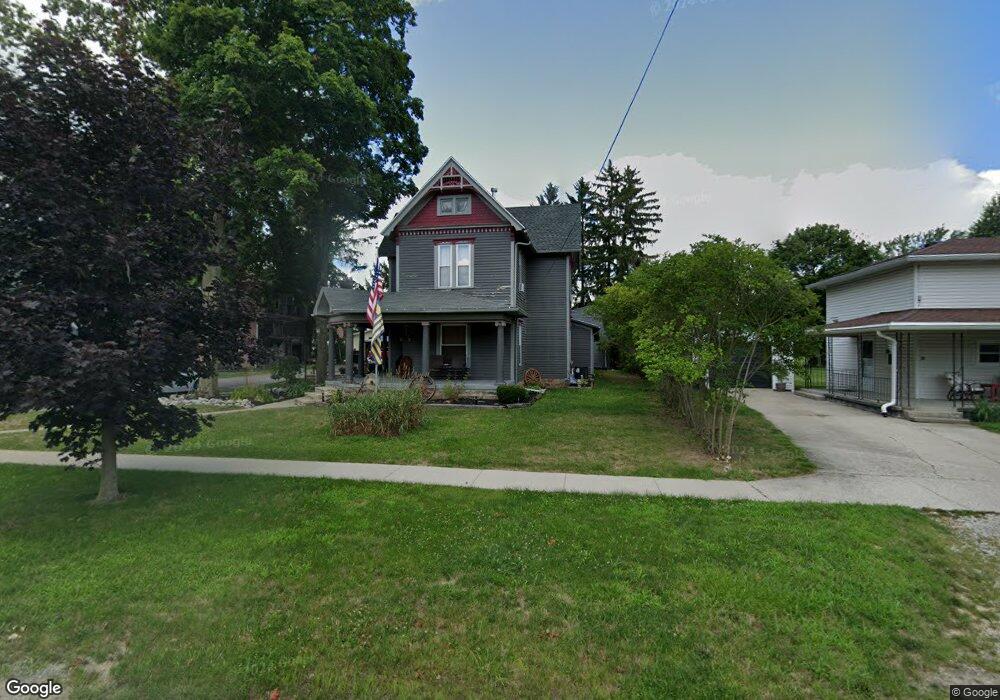
401 E Church St West Unity, OH 43570
Estimated Value: $133,000 - $203,000
4
Beds
1
Bath
1,833
Sq Ft
$90/Sq Ft
Est. Value
About This Home
This home is located at 401 E Church St, West Unity, OH 43570 and is currently estimated at $165,568, approximately $90 per square foot. 401 E Church St is a home located in Williams County with nearby schools including Hilltop Elementary School and Hilltop High School.
Ownership History
Date
Name
Owned For
Owner Type
Purchase Details
Closed on
Mar 10, 2017
Sold by
Rediger Benjamin J and Rediger Goldie L
Bought by
Rediger Denjamin J and Rediger Goldie L
Current Estimated Value
Purchase Details
Closed on
Apr 7, 2016
Sold by
Schneeman Donald C
Bought by
Rediger Goldie L
Purchase Details
Closed on
Sep 25, 2007
Sold by
Burrowes Scott and Burrowes Brenda
Bought by
Schneeman Donald C and Farrell Nancy
Home Financials for this Owner
Home Financials are based on the most recent Mortgage that was taken out on this home.
Original Mortgage
$75,150
Interest Rate
6.49%
Mortgage Type
New Conventional
Purchase Details
Closed on
Jun 18, 1993
Bought by
Burrows Scott and Burrows Brenda
Create a Home Valuation Report for This Property
The Home Valuation Report is an in-depth analysis detailing your home's value as well as a comparison with similar homes in the area
Home Values in the Area
Average Home Value in this Area
Purchase History
| Date | Buyer | Sale Price | Title Company |
|---|---|---|---|
| Rediger Denjamin J | -- | None Available | |
| Rediger Benjamin J | $40,000 | None Available | |
| Rediger Goldie L | -- | None Available | |
| Schneeman Donald C | $83,500 | None Available | |
| Burrows Scott | $48,000 | -- |
Source: Public Records
Mortgage History
| Date | Status | Borrower | Loan Amount |
|---|---|---|---|
| Previous Owner | Schneeman Donald C | $75,150 |
Source: Public Records
Tax History Compared to Growth
Tax History
| Year | Tax Paid | Tax Assessment Tax Assessment Total Assessment is a certain percentage of the fair market value that is determined by local assessors to be the total taxable value of land and additions on the property. | Land | Improvement |
|---|---|---|---|---|
| 2024 | $1,603 | $39,980 | $3,400 | $36,580 |
| 2023 | $1,603 | $33,570 | $3,400 | $30,170 |
| 2022 | $1,600 | $33,570 | $3,400 | $30,170 |
| 2021 | $1,599 | $33,570 | $3,400 | $30,170 |
| 2020 | $1,417 | $28,710 | $2,910 | $25,800 |
| 2019 | $1,395 | $28,710 | $2,910 | $25,800 |
| 2018 | $1,411 | $28,710 | $2,910 | $25,800 |
| 2017 | $1,273 | $25,310 | $2,770 | $22,540 |
| 2016 | $1,215 | $25,310 | $2,770 | $22,540 |
| 2015 | $1,387 | $25,310 | $2,770 | $22,540 |
| 2014 | $1,387 | $26,640 | $2,910 | $23,730 |
| 2013 | $1,369 | $26,640 | $2,910 | $23,730 |
Source: Public Records
Map
Nearby Homes
- 000 W Jackson
- 311 W Rings St
- 205 Taylor Dr
- 340 S Main St
- 22227 Us Highway 20a
- 16806 US Highway 20a
- 15664 County Road K
- 16228 County Road N-30
- 18 Cobblestone Rd
- 0 U S 20
- 305 W Mulberry St
- 3063 County Road 26-2
- 301 Horton St
- 22018 County Road F
- 23161 County Road Jk
- 7170 County Road 23
- 0 St Rt 15 Unit 10001011
- 10628 Ohio 15
- 0 County Road F
- 24218 State Route 2
- 405 E Church St
- 307 E Church St
- 407 E Church St
- 210 Jefferson St
- 406 E Church St
- 409 E Church St Unit AB
- 409 E Church St
- 308 E Church St
- 305 E Church St
- 306 E Church St
- 310 N Liberty St
- 410 E Church St
- 402 N Liberty St
- 201 Jefferson St
- 403 E North St
- 307 E North St
- 210 N Liberty St
- 405 E North St
- 504 E Church St
- 407 E North St