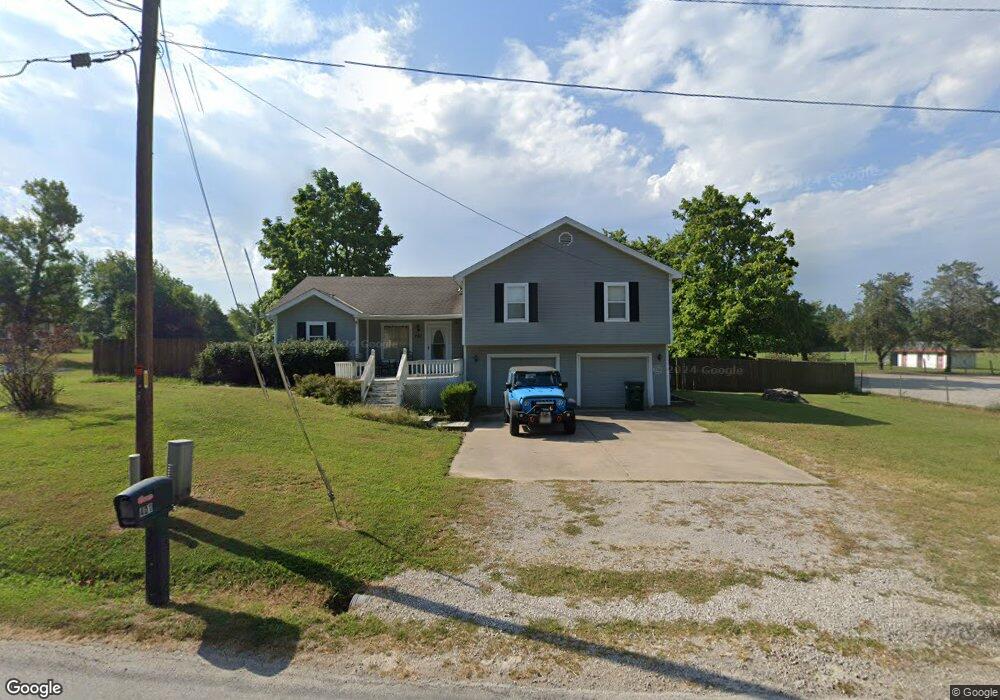
401 E Pine St Archie, MO 64725
Estimated Value: $234,442 - $266,000
3
Beds
3
Baths
1,376
Sq Ft
$182/Sq Ft
Est. Value
About This Home
This home is located at 401 E Pine St, Archie, MO 64725 and is currently estimated at $250,611, approximately $182 per square foot. 401 E Pine St is a home located in Cass County with nearby schools including Archie Elementary School and Archie High School.
Ownership History
Date
Name
Owned For
Owner Type
Purchase Details
Closed on
Feb 14, 2017
Sold by
Hall Gary Melvin
Bought by
Kenney James Ray
Current Estimated Value
Purchase Details
Closed on
May 13, 2008
Sold by
Secretary Of Veterans Affairs
Bought by
Hall Gary Melvin
Home Financials for this Owner
Home Financials are based on the most recent Mortgage that was taken out on this home.
Original Mortgage
$90,000
Interest Rate
6.08%
Mortgage Type
New Conventional
Purchase Details
Closed on
Dec 3, 2007
Sold by
Lutz Arthur L and Lutz Tara L
Bought by
Secretary Of Veterans Affairs
Purchase Details
Closed on
Aug 30, 2005
Sold by
Lutz Arthur L
Bought by
Lutz Arthur L and Lutz Tara L
Home Financials for this Owner
Home Financials are based on the most recent Mortgage that was taken out on this home.
Original Mortgage
$151,696
Interest Rate
5.81%
Mortgage Type
VA
Create a Home Valuation Report for This Property
The Home Valuation Report is an in-depth analysis detailing your home's value as well as a comparison with similar homes in the area
Purchase History
| Date | Buyer | Sale Price | Title Company |
|---|---|---|---|
| Kenney James Ray | -- | None Available | |
| Hall Gary Melvin | -- | -- | |
| Secretary Of Veterans Affairs | $123,382 | -- | |
| Lutz Arthur L | -- | -- | |
| Lutz Arthur L | -- | -- |
Source: Public Records
Mortgage History
| Date | Status | Borrower | Loan Amount |
|---|---|---|---|
| Previous Owner | Hall Gary Melvin | $90,000 | |
| Previous Owner | Lutz Arthur L | $151,696 |
Source: Public Records
Tax History
| Year | Tax Paid | Tax Assessment Tax Assessment Total Assessment is a certain percentage of the fair market value that is determined by local assessors to be the total taxable value of land and additions on the property. | Land | Improvement |
|---|---|---|---|---|
| 2025 | $1,805 | $29,560 | $2,880 | $26,680 |
| 2024 | $1,805 | $25,820 | $2,620 | $23,200 |
| 2023 | $1,800 | $25,820 | $2,620 | $23,200 |
| 2022 | $1,626 | $22,520 | $2,620 | $19,900 |
| 2021 | $1,559 | $22,520 | $2,620 | $19,900 |
| 2020 | $1,522 | $21,720 | $2,620 | $19,100 |
| 2019 | $1,437 | $21,720 | $2,620 | $19,100 |
| 2018 | $1,328 | $19,280 | $2,100 | $17,180 |
| 2017 | $1,154 | $19,280 | $2,100 | $17,180 |
| 2016 | $1,154 | $17,590 | $2,100 | $15,490 |
| 2015 | $1,143 | $17,590 | $2,100 | $15,490 |
| 2014 | $1,142 | $17,590 | $2,100 | $15,490 |
| 2013 | -- | $17,590 | $2,100 | $15,490 |
Source: Public Records
Map
Nearby Homes
- 402 S Jefferson St
- 302 S Truman Rd
- 507 S Wilson St
- 532 S Truman Rd
- 0 State Route A
- 101 N Main St
- 303 W Chestnut St
- 207 Blackberry Cir
- Tract 5 E State Route B
- 300 E Maple St
- 0 E State Route B Hwy Unit HMS2557239
- E State Route A
- Lot 3 NW County Road 17402 N A
- Lot 2 NW County Rd 17402 N A
- 103 W Locust St
- Lot 5 NW County 1501 Rd
- Lot 13 NW County Road 1501
- 19707 E State Route A N A
- 19011 E State Route A
- 520 NE County Road 15504
- 501 S Jefferson St
- 402 E Pine St
- 306 E Pine St
- 403 S Jefferson St
- 502 S Truman Rd
- 504 S Truman Rd
- 406 S Truman Rd
- 506 S Truman Rd
- 502 E Pine St
- 508 S Truman Rd
- 510 S Truman Rd
- 526 S Truman Rd
- 501 S Truman Rd
- 503 S Truman Rd
- 403 S Truman Rd
- 529 S Truman Rd
- 512 S Truman Rd
- 505 S Truman Rd
- 0 E Chestnut St
- 507 S Truman Rd
Your Personal Tour Guide
Ask me questions while you tour the home.