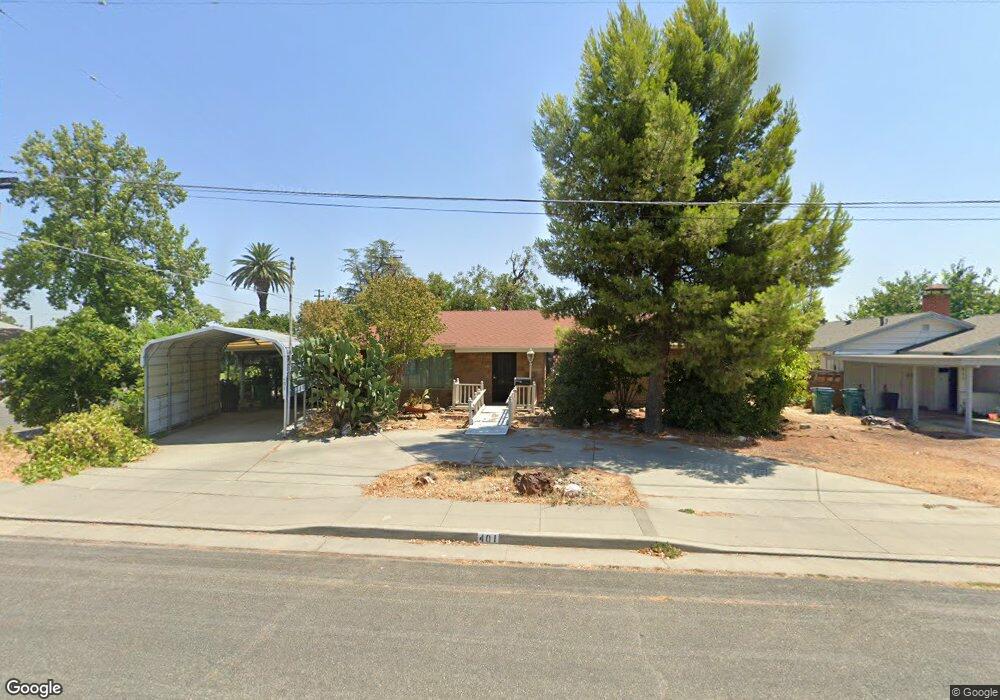
401 East St Orland, CA 95963
Estimated Value: $330,000 - $384,000
3
Beds
2
Baths
1,543
Sq Ft
$236/Sq Ft
Est. Value
About This Home
This home is located at 401 East St, Orland, CA 95963 and is currently estimated at $364,206, approximately $236 per square foot. 401 East St is a home located in Glenn County with nearby schools including Mill Street Elementary School, Fairview Elementary School, and Price Intermediate School.
Ownership History
Date
Name
Owned For
Owner Type
Purchase Details
Closed on
Apr 27, 2018
Sold by
Strubel Mark and Strubel Mark Matthew
Bought by
Strubel Mark
Current Estimated Value
Home Financials for this Owner
Home Financials are based on the most recent Mortgage that was taken out on this home.
Original Mortgage
$125,000
Outstanding Balance
$107,753
Interest Rate
4.45%
Mortgage Type
Commercial
Estimated Equity
$256,453
Purchase Details
Closed on
Feb 15, 2006
Sold by
Fairlee Edward M
Bought by
Boll John T and Boll Diane Dolores
Create a Home Valuation Report for This Property
The Home Valuation Report is an in-depth analysis detailing your home's value as well as a comparison with similar homes in the area
Home Values in the Area
Average Home Value in this Area
Purchase History
| Date | Buyer | Sale Price | Title Company |
|---|---|---|---|
| Strubel Mark | -- | Ticor Title | |
| Strubel Mark | -- | Ticor Title | |
| Boll John T | $260,000 | North State Title Company |
Source: Public Records
Mortgage History
| Date | Status | Borrower | Loan Amount |
|---|---|---|---|
| Open | Strubel Mark | $125,000 |
Source: Public Records
Tax History Compared to Growth
Tax History
| Year | Tax Paid | Tax Assessment Tax Assessment Total Assessment is a certain percentage of the fair market value that is determined by local assessors to be the total taxable value of land and additions on the property. | Land | Improvement |
|---|---|---|---|---|
| 2025 | $3,174 | $300,660 | $47,830 | $252,830 |
| 2024 | $3,174 | $285,082 | $66,000 | $219,082 |
| 2023 | $2,650 | $237,568 | $55,000 | $182,568 |
| 2022 | $2,414 | $215,971 | $54,000 | $161,971 |
| 2021 | $2,223 | $196,337 | $49,459 | $146,878 |
| 2020 | $2,046 | $178,489 | $44,963 | $133,526 |
| 2019 | $1,888 | $162,264 | $40,876 | $121,388 |
| 2018 | $1,686 | $151,649 | $38,202 | $113,447 |
| 2017 | $1,702 | $144,428 | $36,383 | $108,045 |
| 2016 | $1,480 | $137,550 | $34,650 | $102,900 |
| 2015 | $1,408 | $131,000 | $33,000 | $98,000 |
| 2014 | $1,342 | $124,950 | $31,500 | $93,450 |
Source: Public Records
Map
Nearby Homes