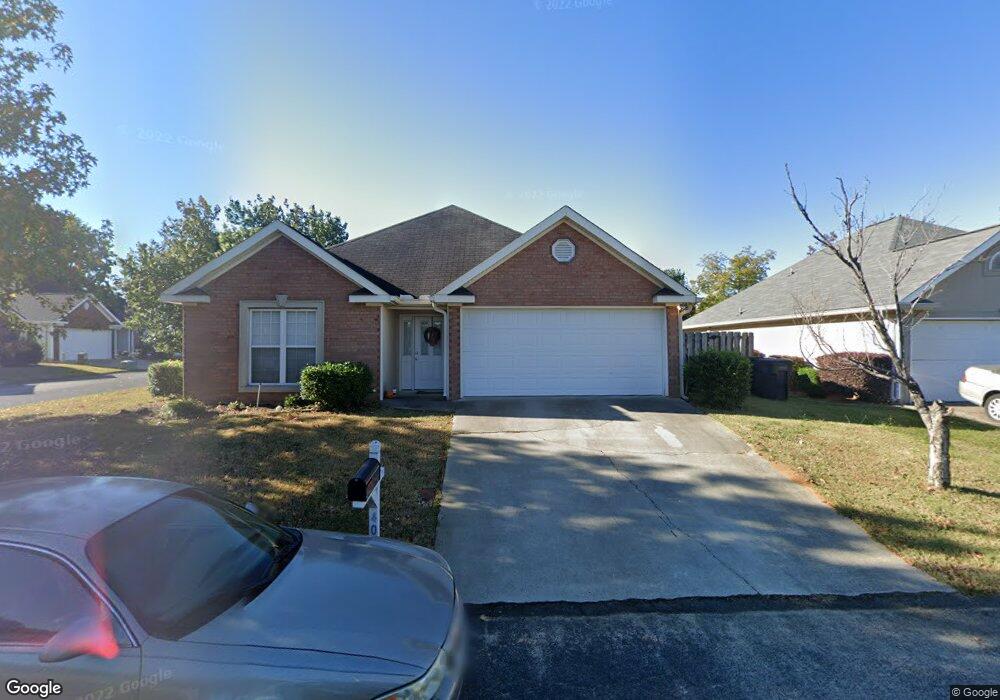
401 Jasper Crossing Augusta, GA 30907
Westside NeighborhoodEstimated Value: $232,958 - $253,000
3
Beds
2
Baths
1,600
Sq Ft
$151/Sq Ft
Est. Value
About This Home
This home is located at 401 Jasper Crossing, Augusta, GA 30907 and is currently estimated at $241,740, approximately $151 per square foot. 401 Jasper Crossing is a home located in Richmond County with nearby schools including First Coast Technical Institute, Warren Road Elementary School, and Tutt Middle School.
Ownership History
Date
Name
Owned For
Owner Type
Purchase Details
Closed on
Feb 15, 2008
Sold by
Shelnut Properties Ltd
Bought by
Melton John C
Current Estimated Value
Purchase Details
Closed on
Feb 13, 2008
Sold by
Whisenhunt Children Inc
Bought by
Shelnut Properties Ltd
Purchase Details
Closed on
Jun 14, 2004
Sold by
Ott Marlene E
Bought by
Shelnut Properties Ltd
Purchase Details
Closed on
Jun 15, 2001
Sold by
Sarkhail Masoud
Bought by
Ott Marlene E
Home Financials for this Owner
Home Financials are based on the most recent Mortgage that was taken out on this home.
Original Mortgage
$72,000
Interest Rate
7.11%
Purchase Details
Closed on
Jul 8, 1998
Sold by
D & H Development Inc
Bought by
Sarkhail Masoud
Purchase Details
Closed on
Apr 21, 1997
Sold by
D&H Development Inc
Bought by
Sarkhail Masoud
Purchase Details
Closed on
Apr 18, 1997
Sold by
D&H Development Inc
Bought by
Sarkhail Masoud
Create a Home Valuation Report for This Property
The Home Valuation Report is an in-depth analysis detailing your home's value as well as a comparison with similar homes in the area
Home Values in the Area
Average Home Value in this Area
Purchase History
| Date | Buyer | Sale Price | Title Company |
|---|---|---|---|
| Melton John C | $119,000 | None Available | |
| Shelnut Properties Ltd | -- | None Available | |
| Shelnut Properties Ltd | $124,000 | -- | |
| Ott Marlene E | $116,000 | -- | |
| Sarkhail Masoud | -- | -- | |
| Sarkhail Masoud | -- | -- | |
| Sarkhail Masoud | $94,000 | -- |
Source: Public Records
Mortgage History
| Date | Status | Borrower | Loan Amount |
|---|---|---|---|
| Previous Owner | Ott Marlene E | $72,000 |
Source: Public Records
Tax History Compared to Growth
Tax History
| Year | Tax Paid | Tax Assessment Tax Assessment Total Assessment is a certain percentage of the fair market value that is determined by local assessors to be the total taxable value of land and additions on the property. | Land | Improvement |
|---|---|---|---|---|
| 2025 | $2,929 | $93,372 | $11,400 | $81,972 |
| 2024 | $2,929 | $88,644 | $11,400 | $77,244 |
| 2023 | $2,688 | $85,928 | $11,400 | $74,528 |
| 2022 | $1,758 | $51,674 | $11,400 | $40,274 |
| 2021 | $2,056 | $56,791 | $11,400 | $45,391 |
| 2020 | $2,023 | $56,791 | $11,400 | $45,391 |
| 2019 | $2,001 | $52,245 | $10,400 | $41,845 |
| 2018 | $2,015 | $52,245 | $10,400 | $41,845 |
| 2017 | $2,005 | $52,245 | $10,400 | $41,845 |
| 2016 | $2,007 | $52,245 | $10,400 | $41,845 |
| 2015 | $2,021 | $52,245 | $10,400 | $41,845 |
| 2014 | $2,023 | $52,245 | $10,400 | $41,845 |
Source: Public Records
Map
Nearby Homes
- 256 Hudson Trace
- 1405 Colony Place Dr
- 1017 Stevens Creek Rd
- 1017 Stevens Creek Rd Unit G182
- 2108 Turtle Ct
- 2111 Turtle Ct
- 1001 Windsong Cir
- 46 Charlestowne Dr
- 2695 York Dr
- 104 York Way
- 3130 Village West Dr
- 2171 River Park Ct
- 3038 Sterling Rd
- 2330 Lions Gate Dr
- 3203 West Ct
- 206 Warren Rd
- 2032 Summer Valley Way
- 2044 Bridgewater Dr
- 2020 Autumn Chase
- 403 Jasper Crossing
- 521 Ellison Way
- 405 Jasper Crossing
- 526 Ellison Way
- 530 Ellison Way
- 404 Jasper Crossing
- 524 Ellison Way
- 407 Jasper Crossing
- 523 Ellison Way
- 406 Jasper Crossing
- 532 Ellison Way
- 522 Ellison Way
- 408 Jasper Crossing
- 301 Alcock Way
- 409 Jasper Crossing
- 520 Ellison Way
- 303 Alcock Way
- 305 Alcock Way
- 410 Jasper Crossing