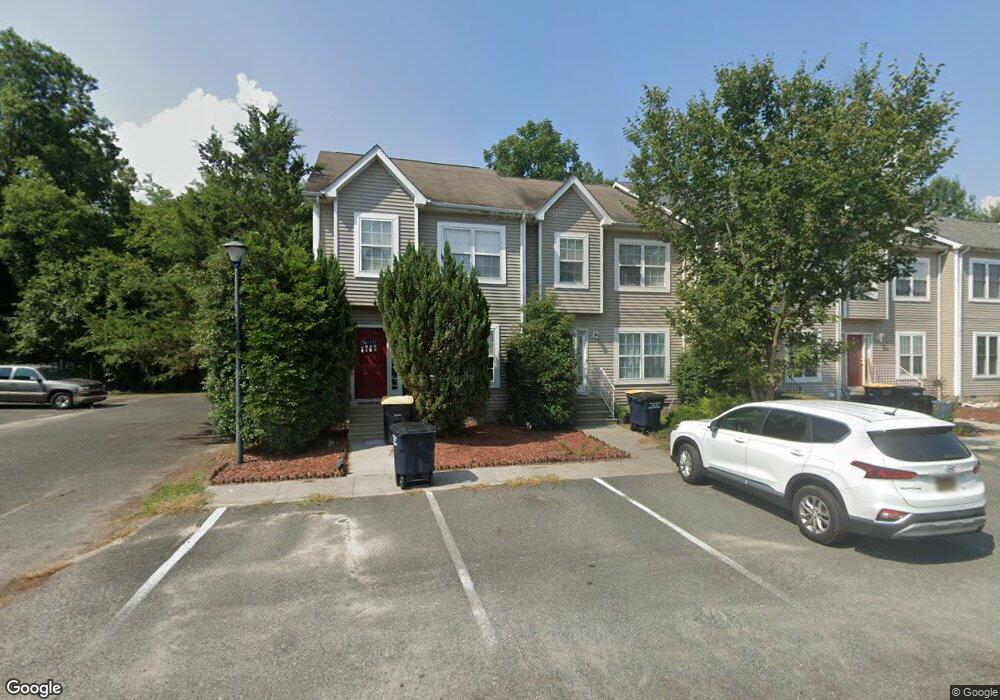
401 Laurel Ct Laurel, DE 19956
Estimated Value: $209,000 - $244,000
3
Beds
3
Baths
1,254
Sq Ft
$176/Sq Ft
Est. Value
About This Home
This home is located at 401 Laurel Ct, Laurel, DE 19956 and is currently estimated at $220,619, approximately $175 per square foot. 401 Laurel Ct is a home located in Sussex County with nearby schools including North Laurel Elementary School, Laurel Elementary School, and Laurel Intermediate Middle School.
Ownership History
Date
Name
Owned For
Owner Type
Purchase Details
Closed on
Feb 13, 2025
Sold by
Glassman John
Bought by
Mcfarling Ansley J
Current Estimated Value
Purchase Details
Closed on
Jul 16, 2018
Sold by
Hochstedler Jacob A and Hochstedler Cheri R
Bought by
Glassman John
Home Financials for this Owner
Home Financials are based on the most recent Mortgage that was taken out on this home.
Original Mortgage
$111,111
Interest Rate
4.6%
Mortgage Type
New Conventional
Create a Home Valuation Report for This Property
The Home Valuation Report is an in-depth analysis detailing your home's value as well as a comparison with similar homes in the area
Home Values in the Area
Average Home Value in this Area
Purchase History
| Date | Buyer | Sale Price | Title Company |
|---|---|---|---|
| Mcfarling Ansley J | $199,000 | None Listed On Document | |
| Mcfarling Ansley J | $199,000 | None Listed On Document | |
| Glassman John | $110,000 | -- |
Source: Public Records
Mortgage History
| Date | Status | Borrower | Loan Amount |
|---|---|---|---|
| Previous Owner | Glassman John | $111,111 |
Source: Public Records
Tax History
| Year | Tax Paid | Tax Assessment Tax Assessment Total Assessment is a certain percentage of the fair market value that is determined by local assessors to be the total taxable value of land and additions on the property. | Land | Improvement |
|---|---|---|---|---|
| 2025 | $572 | $16,300 | $450 | $15,850 |
| 2024 | $852 | $16,300 | $450 | $15,850 |
| 2023 | $971 | $16,300 | $450 | $15,850 |
| 2022 | $844 | $16,300 | $450 | $15,850 |
| 2021 | $837 | $16,300 | $450 | $15,850 |
| 2020 | $857 | $16,300 | $450 | $15,850 |
| 2019 | $860 | $16,300 | $450 | $15,850 |
| 2018 | $962 | $16,300 | $0 | $0 |
| 2017 | $933 | $16,300 | $0 | $0 |
| 2016 | $989 | $16,300 | $0 | $0 |
| 2015 | $860 | $16,300 | $0 | $0 |
| 2014 | $768 | $16,300 | $0 | $0 |
Source: Public Records
Map
Nearby Homes
- 9258 Sharptown Rd
- 9269 Sharptown Rd
- 216 W 8th St
- 209 W 7th St
- 223 W 7th St
- 211 W 6th St
- 405 Park Ln
- 402 Pine St
- 205 W Front St Unit A
- 0 Iona Ave Unit DESU2096064
- 1154 W 6th St
- 108 Crockett Ave
- 99999 Ionia Ave
- 1176 W 6th St
- 204 Turtle Cove Unit 115
- 31566 White St
- 101 Records Pond Ct Unit 9
- 32076 Gordy Rd
- 31536 White St
- 10954 E 4th St
Your Personal Tour Guide
Ask me questions while you tour the home.