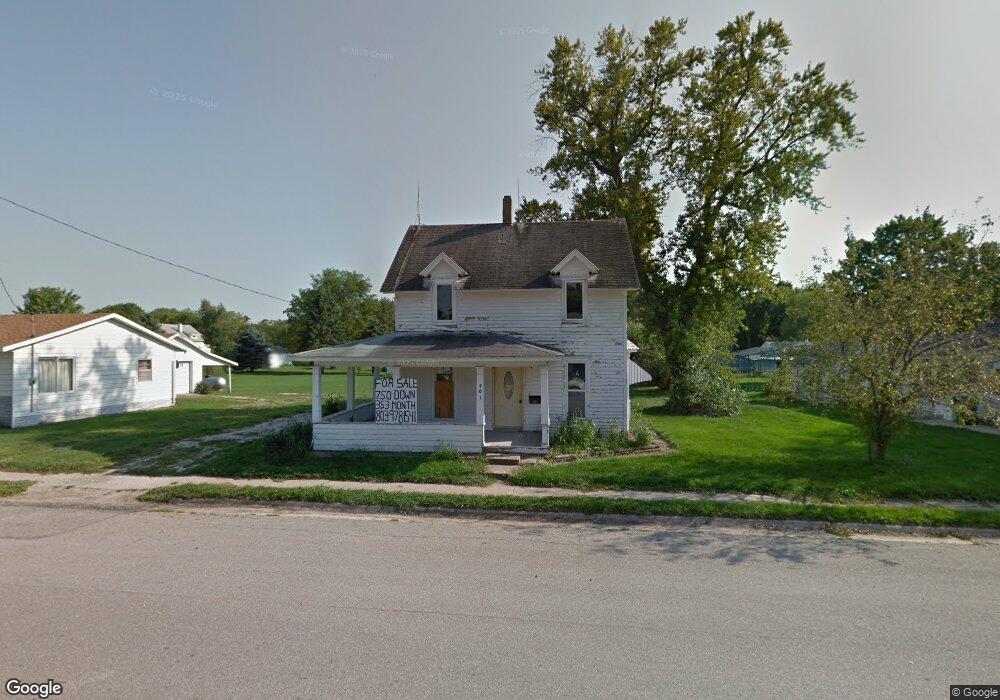
401 Main St Brandon, IA 52210
Estimated Value: $67,583 - $228,000
3
Beds
1
Bath
1,309
Sq Ft
$98/Sq Ft
Est. Value
About This Home
This home is located at 401 Main St, Brandon, IA 52210 and is currently estimated at $128,646, approximately $98 per square foot. 401 Main St is a home located in Buchanan County with nearby schools including West Elementary School, East Elementary School, and Independence Junior/Senior High School.
Ownership History
Date
Name
Owned For
Owner Type
Purchase Details
Closed on
Feb 12, 2013
Sold by
Bat Holdings Six Llc
Bought by
Pecinovsky Caroline A
Current Estimated Value
Home Financials for this Owner
Home Financials are based on the most recent Mortgage that was taken out on this home.
Original Mortgage
$20,000
Outstanding Balance
$13,936
Interest Rate
3.34%
Mortgage Type
New Conventional
Estimated Equity
$114,710
Purchase Details
Closed on
Jun 28, 2012
Sold by
Federal National Mortgage Association
Bought by
Bat Holdings Six Llc
Create a Home Valuation Report for This Property
The Home Valuation Report is an in-depth analysis detailing your home's value as well as a comparison with similar homes in the area
Purchase History
| Date | Buyer | Sale Price | Title Company |
|---|---|---|---|
| Pecinovsky Caroline A | $13,500 | None Available | |
| Bat Holdings Six Llc | $6,580 | Servicelink |
Source: Public Records
Mortgage History
| Date | Status | Borrower | Loan Amount |
|---|---|---|---|
| Open | Pecinovsky Caroline A | $20,000 |
Source: Public Records
Tax History
| Year | Tax Paid | Tax Assessment Tax Assessment Total Assessment is a certain percentage of the fair market value that is determined by local assessors to be the total taxable value of land and additions on the property. | Land | Improvement |
|---|---|---|---|---|
| 2025 | $560 | $50,930 | $11,550 | $39,380 |
| 2024 | $560 | $43,560 | $10,310 | $33,250 |
| 2023 | $506 | $43,560 | $10,310 | $33,250 |
| 2022 | $456 | $34,770 | $8,180 | $26,590 |
| 2021 | $446 | $34,770 | $8,180 | $26,590 |
| 2020 | $446 | $31,950 | $7,220 | $24,730 |
| 2019 | $428 | $31,950 | $7,220 | $24,730 |
| 2018 | $430 | $29,920 | $7,220 | $22,700 |
| 2017 | $428 | $31,070 | $7,220 | $23,850 |
| 2016 | $416 | $30,120 | $4,580 | $25,540 |
| 2015 | $416 | $30,120 | $4,580 | $25,540 |
| 2014 | $426 | $30,120 | $4,580 | $25,540 |
Source: Public Records
Map
Nearby Homes
- 25th Avenue
- 705 South St
- 3251 Brandon Diagonal Blvd
- 0 25th Ave
- 0 Tbd 325th St
- 54th St
- TBD 54th St
- 215 Traer St
- 302 Lewis St
- PARCEL "A" LOCA 55th St
- 0 Garling Rd
- 5515 24th Avenue Dr
- 5454 22nd Ave Unit Lot 24
- TBD Jamestown Ave
- 00 Garling Rd
- 0 31st Ave
- 2332 55th Street Dr
- 0 51st St Ln Unit 2600145
- 13518 King Rd
- 5358 Hutton Dr
Your Personal Tour Guide
Ask me questions while you tour the home.