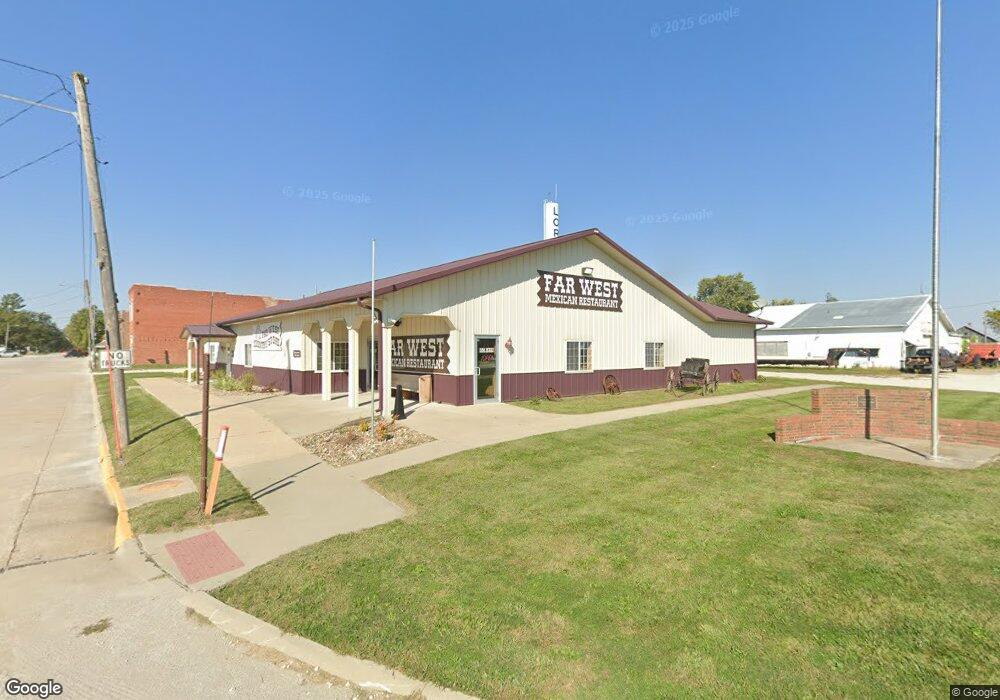
401 Main St Lorimor, IA 50149
Estimated Value: $735,000
Studio
--
Bath
5,692
Sq Ft
$129/Sq Ft
Est. Value
About This Home
This home is located at 401 Main St, Lorimor, IA 50149 and is currently priced at $735,000, approximately $129 per square foot. 401 Main St is a home located in Union County with nearby schools including East Union Middle/High School.
Ownership History
Date
Name
Owned For
Owner Type
Purchase Details
Closed on
Dec 13, 2023
Sold by
Love David P
Bought by
Galaviz Fernando Isaac and Delgalaviz Pilar Del
Current Estimated Value
Purchase Details
Closed on
Sep 8, 2014
Sold by
Graff Bruce
Bought by
Love David P
Create a Home Valuation Report for This Property
The Home Valuation Report is an in-depth analysis detailing your home's value as well as a comparison with similar homes in the area
Purchase History
| Date | Buyer | Sale Price | Title Company |
|---|---|---|---|
| Galaviz Fernando Isaac | $130,500 | None Listed On Document | |
| Galaviz Fernando Isaac | $130,500 | None Listed On Document | |
| Love David P | -- | None Available |
Source: Public Records
Tax History
| Year | Tax Paid | Tax Assessment Tax Assessment Total Assessment is a certain percentage of the fair market value that is determined by local assessors to be the total taxable value of land and additions on the property. | Land | Improvement |
|---|---|---|---|---|
| 2025 | $5,780 | $240,490 | $10,260 | $230,230 |
| 2024 | $5,780 | $218,800 | $10,260 | $208,540 |
| 2023 | $5,624 | $207,600 | $10,260 | $197,340 |
| 2022 | $5,054 | $192,630 | $10,260 | $182,370 |
| 2021 | $5,054 | $192,630 | $10,260 | $182,370 |
| 2020 | $4,424 | $192,630 | $10,260 | $182,370 |
| 2019 | $4,110 | $155,070 | $0 | $0 |
| 2018 | $3,224 | $124,200 | $0 | $0 |
| 2017 | $1,676 | $63,000 | $0 | $0 |
| 2016 | $758 | $32,130 | $0 | $0 |
| 2015 | $758 | $1,270 | $0 | $0 |
| 2014 | $30 | $1,270 | $0 | $0 |
Source: Public Records
Map
Nearby Homes
Your Personal Tour Guide
Ask me questions while you tour the home.