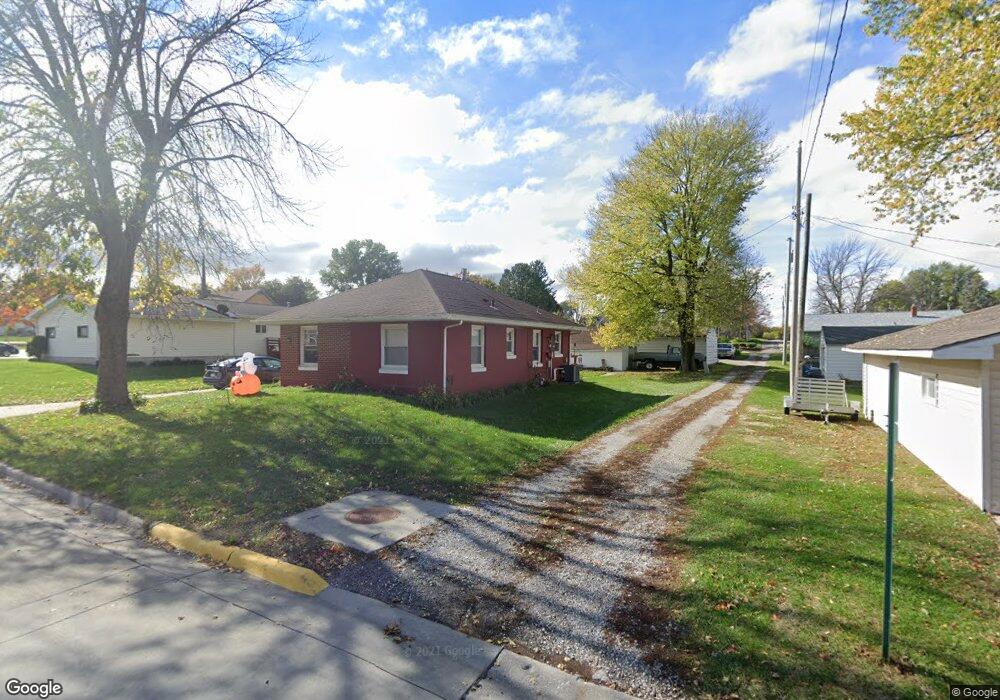
401 Main St Victor, IA 52347
Estimated Value: $70,000 - $112,000
2
Beds
1
Bath
888
Sq Ft
$104/Sq Ft
Est. Value
About This Home
This home is located at 401 Main St, Victor, IA 52347 and is currently estimated at $92,456, approximately $104 per square foot. 401 Main St is a home located in Iowa County.
Ownership History
Date
Name
Owned For
Owner Type
Purchase Details
Closed on
Feb 17, 2020
Sold by
Roskam Ryan J and Roskam Karen
Bought by
Panosh Brandy A
Current Estimated Value
Home Financials for this Owner
Home Financials are based on the most recent Mortgage that was taken out on this home.
Original Mortgage
$35,200
Outstanding Balance
$31,167
Interest Rate
3.6%
Mortgage Type
New Conventional
Estimated Equity
$61,289
Purchase Details
Closed on
Mar 31, 2006
Sold by
Green Luann Catherine and Doran Luann Catherine
Bought by
Roskam Ryan J
Create a Home Valuation Report for This Property
The Home Valuation Report is an in-depth analysis detailing your home's value as well as a comparison with similar homes in the area
Home Values in the Area
Average Home Value in this Area
Purchase History
| Date | Buyer | Sale Price | Title Company |
|---|---|---|---|
| Panosh Brandy A | $44,000 | None Available | |
| Roskam Ryan J | $49,000 | None Available |
Source: Public Records
Mortgage History
| Date | Status | Borrower | Loan Amount |
|---|---|---|---|
| Open | Panosh Brandy A | $35,200 |
Source: Public Records
Tax History Compared to Growth
Tax History
| Year | Tax Paid | Tax Assessment Tax Assessment Total Assessment is a certain percentage of the fair market value that is determined by local assessors to be the total taxable value of land and additions on the property. | Land | Improvement |
|---|---|---|---|---|
| 2024 | $884 | $67,310 | $13,110 | $54,200 |
| 2023 | $854 | $65,870 | $13,110 | $52,760 |
| 2022 | $834 | $54,910 | $13,110 | $41,800 |
| 2021 | $890 | $54,910 | $13,110 | $41,800 |
| 2020 | $1,028 | $55,000 | $11,970 | $43,030 |
| 2019 | $1,014 | $55,000 | $11,970 | $43,030 |
| 2018 | $986 | $52,460 | $10,830 | $41,630 |
| 2017 | $958 | $52,460 | $10,830 | $41,630 |
| 2016 | $928 | $50,650 | $10,830 | $39,820 |
| 2015 | $928 | $50,650 | $10,830 | $39,820 |
| 2014 | $972 | $52,580 | $10,830 | $41,750 |
Source: Public Records
Map
Nearby Homes