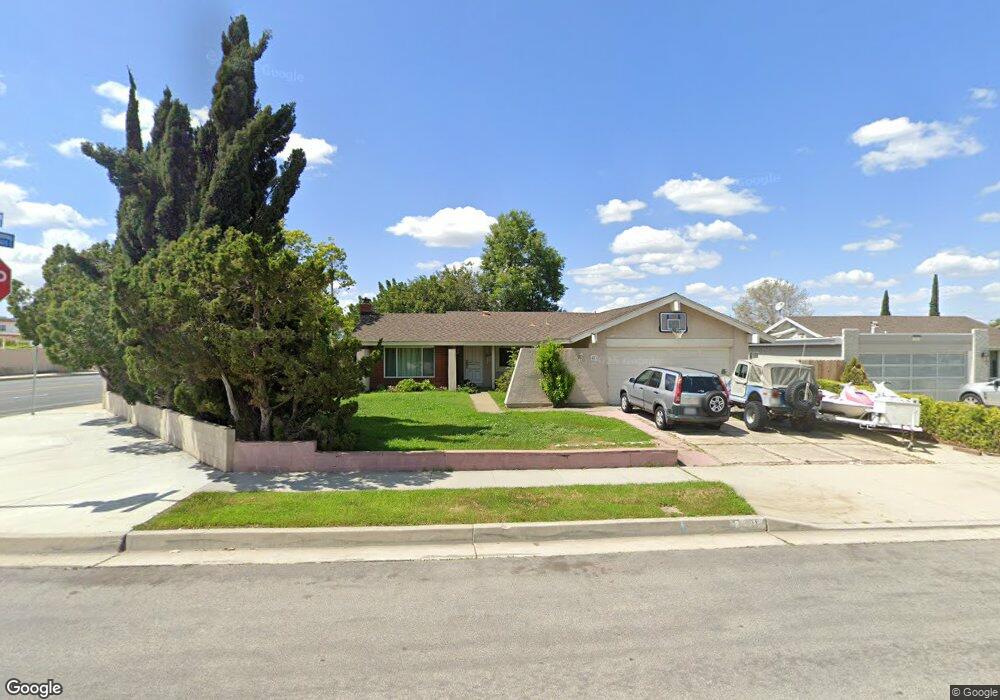
401 N Deerfield St Anaheim, CA 92807
Anaheim Hills NeighborhoodEstimated Value: $926,812 - $1,111,000
3
Beds
2
Baths
1,502
Sq Ft
$673/Sq Ft
Est. Value
About This Home
This home is located at 401 N Deerfield St, Anaheim, CA 92807 and is currently estimated at $1,010,203, approximately $672 per square foot. 401 N Deerfield St is a home located in Orange County with nearby schools including Olive Elementary School, Canyon High School, and El Rancho Charter.
Ownership History
Date
Name
Owned For
Owner Type
Purchase Details
Closed on
Oct 1, 2025
Sold by
Williams Anthony Paul
Bought by
Revive Offers Llc
Current Estimated Value
Home Financials for this Owner
Home Financials are based on the most recent Mortgage that was taken out on this home.
Original Mortgage
$540,000
Outstanding Balance
$540,000
Interest Rate
6.5%
Mortgage Type
Construction
Estimated Equity
$470,203
Purchase Details
Closed on
Dec 16, 1996
Sold by
Va
Bought by
Williams Anthony Paul and Williams Judith Ann
Home Financials for this Owner
Home Financials are based on the most recent Mortgage that was taken out on this home.
Original Mortgage
$147,250
Interest Rate
7.67%
Mortgage Type
Seller Take Back
Purchase Details
Closed on
Jul 24, 1996
Sold by
Nationsbanc Mtg Corp
Bought by
Va
Purchase Details
Closed on
Jul 18, 1996
Sold by
Baker Walter R and Baker Elizabeth A
Bought by
Nationsbanc Mtg Corp
Create a Home Valuation Report for This Property
The Home Valuation Report is an in-depth analysis detailing your home's value as well as a comparison with similar homes in the area
Home Values in the Area
Average Home Value in this Area
Purchase History
| Date | Buyer | Sale Price | Title Company |
|---|---|---|---|
| Revive Offers Llc | $850,000 | Usa National Title | |
| Williams Anthony Paul | $150,000 | Chicago Title Co | |
| Va | -- | Benefit Land Title Ins Co | |
| Nationsbanc Mtg Corp | $140,151 | Benefit Land Title Ins Compa |
Source: Public Records
Mortgage History
| Date | Status | Borrower | Loan Amount |
|---|---|---|---|
| Open | Revive Offers Llc | $540,000 | |
| Previous Owner | Williams Anthony Paul | $147,250 |
Source: Public Records
Tax History Compared to Growth
Tax History
| Year | Tax Paid | Tax Assessment Tax Assessment Total Assessment is a certain percentage of the fair market value that is determined by local assessors to be the total taxable value of land and additions on the property. | Land | Improvement |
|---|---|---|---|---|
| 2025 | $2,923 | $244,292 | $141,751 | $102,541 |
| 2024 | $2,923 | $239,502 | $138,971 | $100,531 |
| 2023 | $2,855 | $234,806 | $136,246 | $98,560 |
| 2022 | $2,798 | $230,202 | $133,574 | $96,628 |
| 2021 | $2,723 | $225,689 | $130,955 | $94,734 |
| 2020 | $2,698 | $223,375 | $129,612 | $93,763 |
| 2019 | $2,667 | $218,996 | $127,071 | $91,925 |
| 2018 | $2,627 | $214,702 | $124,579 | $90,123 |
| 2017 | $2,524 | $210,493 | $122,137 | $88,356 |
| 2016 | $2,477 | $206,366 | $119,742 | $86,624 |
| 2015 | $2,444 | $203,267 | $117,944 | $85,323 |
| 2014 | $2,393 | $199,286 | $115,634 | $83,652 |
Source: Public Records
Map
Nearby Homes
- 4433 E Lani Ave
- 408 N Torrens St
- 4809 E Wasatch Dr
- 4864 E Mckinnon Dr
- 5059 E Crescent Dr
- 500 N Tustin Ave Unit 218
- 419 N Tustin Ave
- 307 N Tustin Ave
- 1952 Avenida Del Sol
- 1963 Via de la Luna
- 4263 E Ranch Gate Rd
- 1958 Avenida Del Sol
- 1664 Via de la Luna
- 451 S Wishing Well Ln
- 4179 N Santa Lucia St
- 1645 La Paloma Ave
- 3211 E Mandeville Place
- 1712 N Glenview Ave
- 580 S Londerry Ln
- 1663 Oak St
- 405 N Deerfield St
- 411 N Deerfield St
- 4420 E Bluewater Cir
- 329 N Deerfield St
- 404 N Deerfield St
- 400 N Deerfield St
- 410 N Deerfield St
- 417 N Deerfield St
- 328 N Sweetwater St
- 4416 E Bluewater Cir
- 325 N Deerfield St
- 4425 E Bainbridge Cir
- 423 N Deerfield St
- 324 N Sweetwater St
- 4421 E Bluewater Cir
- 4412 E Bluewater Cir
- 405 N Leaf Cir
- 4425 E Lani Ave
- 401 N Leaf Cir
- 4429 E Bainbridge Cir